Analyze communications using social network analytics
Use the social network analytics feature to view the email communication patterns between people and organizations. This feature helps you to understand which people or organizations are communicating with each other and what they are communicating about. This feature is well suited for early case assessment and investigations where you are not sure what you are looking for.
To use the social network analytics feature, add one or more of the following panes to your workspace:
Domain Network: Displays email communication between organizations. For more information, see View the communication between organizations in the Domain Network pane.
Communication Network: Displays email communication between people or identities. For more information, see View the communication between people in the Communication Network pane.
Concept Cloud: Displays the concepts that organizations or people are communicating about in their email communication. For more information, see View concepts that people or organizations communicate about in the Concept Cloud pane.
For information about how to add panes to your workspace, see Customize the workspace.
Note: Your administrator must enable these features.
The information in the panes stays in sync when you switch from one pane to another.
Social network analytics sample workflow
You can work with the social network analytics feature with any search results set. A sample workflow might look like the following:
Configure a workspace with the following panes: Browse, Domain Network, and Communication Network.
To explore the emails between organizations, in the Browse pane, in the Organizations section, select an organization.
View the results and the visualization in the Domain Network pane to see which organizations are communicating with each other.
To view details about emails between people, in the Domain Network pane, select a line between two organizations, and then view the visualization in the Communication Network pane.
Add the Concept Cloud pane to your workspace to get an overview of the concepts that people or organizations are communicating about.
Note: To view documents, add either a List or Map pane and a View pane to your workspace.
View the communication between organizations in the Domain Network pane
In the Domain Network pane, you can view email communication between organizations.
The Domain Network pane includes the following main components: a toolbar, a grid, and a visualization pane.
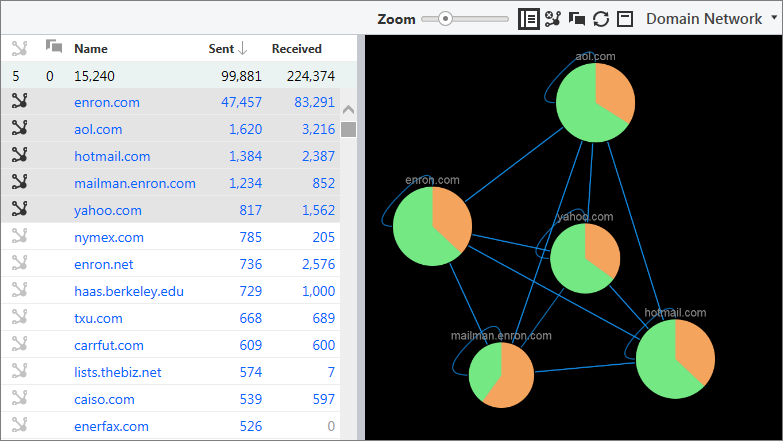
The visualization pane, which is located on the right side of the pane, provides a graphic representation of the communication between organizations. Each node in the visualization pane represents an organization. The lines connecting the nodes show which organizations communicated with each other. The colors in each node show the proportion of emails that an organization sent or received.
To view the communication between organizations in the Domain Network pane:
On the Documents page, configure a workspace with the Browse and Domain Network panes. For information about how to add panes to your workspace, see Customize the workspace.
Note: To view documents, add either a List or Map pane and a View pane to your workspace.
In the Browse pane, in the Organizations section, select an organization.
To see which organizations are communicating with each other, view the results and visualization in the Domain Network pane.
Work with the features and information in the grid, located on the left side of the pane, in the following ways:
Nodes: The first column displays the number of nodes in the visualization pane. Each node in the visualization pane represents an organization. To show or hide nodes in the visualization, click the buttons in this column.
Participants: The second column displays the number of participants in the selected emails, and indicates the organizations who are active participants in the emails.
Name: To select the emails that an organization sent or received, click a name.
Sent: To select the emails that an organization sent, click a number.
Received: To select the emails that an organization received, click a number.
Work with the additional features in the Domain Network pane in the following ways:
Use the Zoom slider to zoom in and out of the visualization. You can also use your mouse to adjust the position of the nodes and to zoom in and out.
Use the following buttons on the toolbar:
Tip: We recommend that you pin the following menu options to the toolbar for easy access.
Hide grid: Click this button to hide the grid. Click the button again to show the grid.
Hide all nodes: Click this button to hide all nodes.
Show selected nodes: Click this button to show all nodes that include organizations for the selected email communication, and to hide all other nodes.
Redraw: Click this button on the toolbar to reset the visualization.
Collapse: Click this button to collapse the pane.
To select the emails that an organization sent and received, click a node. When you click a node, a blue ring appears around the node. Red connecting lines indicate all of the organizations who participated in the selected emails.
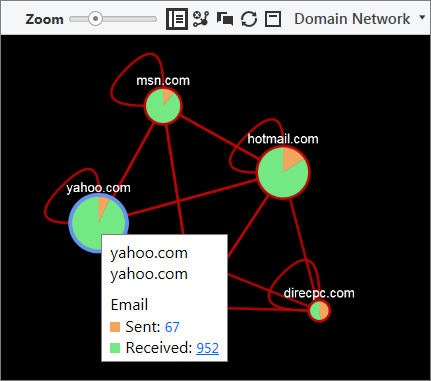
To view the emails that an organization sent or received, hover over a node.
To select the emails between two organizations, click a connecting line.
To view details about the number of emails and the direction of the communication between two organizations, hover over a connecting line.
View the communication between people or identities in the Communication Network pane
In the Communication Network pane, you can view email communication between people or identities.
The Communication Network pane includes the following main components: a toolbar, a grid, and a visualization pane.
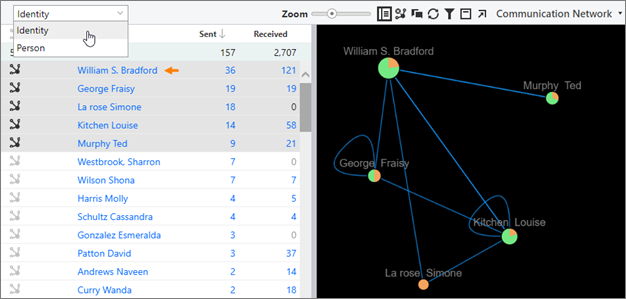
The visualization pane, which is located on the right side of the pane, provides a graphic representation of the email communication between people. Each node in the visualization pane represents a person or identity.
Note: An administrator (or a group leader with permissions) can normalize an individual's people names, such as email addresses and user names, into a single identity using the People Identity feature on the Case Setup page.
The lines connecting the nodes show which people communicated with each other. The colors in each node show the proportion of emails that people sent or received.
To view the communication between people or identities in the Communication Network pane:
On the Documents page, configure a workspace with the Browse and Communication Network panes. For information about how to add panes to your workspace, see Customize the workspace.
Note: To view documents, add either a List or Map pane and a View pane to your workspace.
In the Browse pane, in the Organizations section, select an organization.
To see which people or identities are communicating with each other, view the results and visualization in the Communication Network pane.
Work with the features and information in the grid, which is located on the left side of the pane, in the following ways:
Nodes: The first column displays the number of nodes in the visualization pane. Each node in the visualization pane represents a person. To show or hide nodes in the visualization, click the buttons in this column.
Participants: The second column displays the number of participants in the selected emails, and indicates the people who are active participants in the emails.
Name: To select the emails that a person sent or received, click a name.
Sent: To select the emails that a person sent, click a number.
Received: To select the emails that a person received, click a number.
Work with the additional features in the Communication Network pane in the following ways:
To view the results for an identity, in the list on the toolbar, select Identity.
To view the results for a person, in the list on the toolbar, select Person.
Use the Zoom slider to zoom in and out of the visualization. You can also use your mouse to adjust the position of the nodes and to zoom in and out.
Use the following additional buttons on the toolbar:
Tip: We recommend that you pin the following menu options to the toolbar for easy access.
Hide grid: Click this button on the toolbar to hide the grid. Click the button again to show the grid.
Hide all nodes: Click this button on the toolbar to hide all nodes.
Show selected nodes: Click this button on the toolbar to show all nodes that include people for the selected email communication, and to hide all other nodes.
Redraw: Click this button on the toolbar to reset the visualization.
Filter recipients: Click this button on the toolbar to filter the visualization by recipients.
Collapse: Click this button to collapse the pane.
To select the emails that a person or identity sent and received, click a node. When you click a node, a blue ring appears around the node. Red connecting lines indicate all of the people who participated in the selected emails.
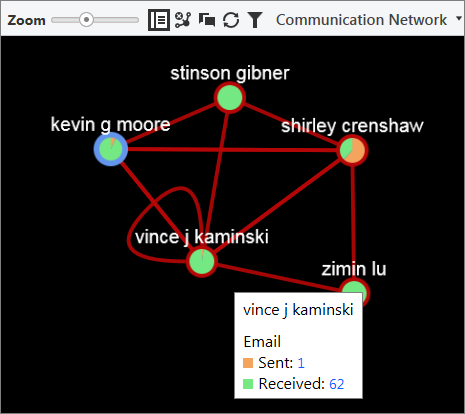
To view the emails that a person or identity sent or received, hover over a node.
To select the emails between two people or identities, click a connecting line.
To view details about the number of emails and the direction of the communication between two people or identities, hover over a connecting line.
View concepts that people or organizations communicate about in the Concept Cloud pane
In the Concept Cloud pane, you can view the concepts that organizations or people are communicating about. The Concept Cloud pane displays the most important concepts for your search results. The larger the word, the more important the concept is.
The following figure shows an example of the Concept Cloud pane.
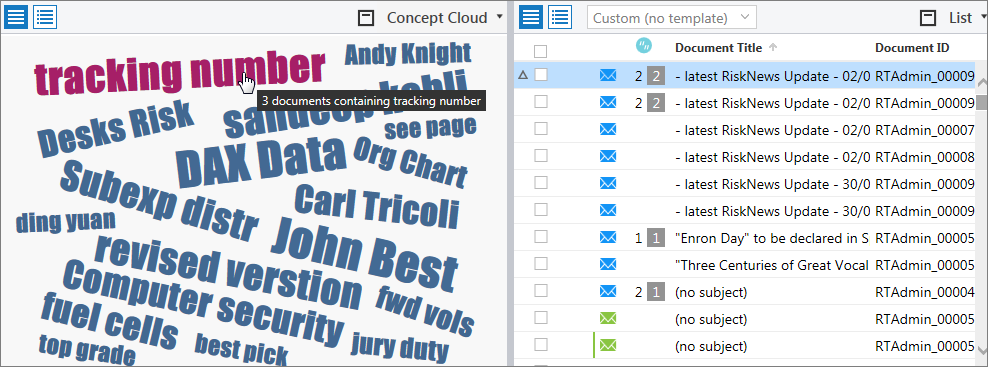
Note: The Concept Cloud pane in the social network analytics feature works differently from the Concept Cloud on the Case Home page. In the Concept Cloud on the Case Home page, the larger the word is, the more common the concept is.
To work with the Concept Cloud pane:
On the Documents page, add the Concept Cloud pane and the List pane, as well as a Domain Network pane or a Communication Network pane to your workspace. For information about how to add panes to your workspace, see Customize the workspace.
To select the documents within your search results that include a specific concept, click a concept name.
To see the concepts that specific documents contain, in the List pane, select the check box next to those documents.
In the Concept Cloud pane, click the Concept cloud for working list button to view the concepts for the selected documents.