Model Validation
After successfully creating a working model (create a skill, upload training text, and click build model), run validation to test the strength of the newly created model. Before executing validation, you need to collect validation text documents. Validation text documents have two subsections: negative testing sets and positive testing sets.
Negative testing sets will consist of documents that do not resemble the skill being validated.
Positive testing sets will consist of documents that do resemble the skill being validated.
Overall you will want at least 25 negative validation documents and at least 25 positive validation documents in comparison to your baseline 75-150 model training documents.
Once you have collected both your negative and positive validation documents, follow the below steps to validate your model.
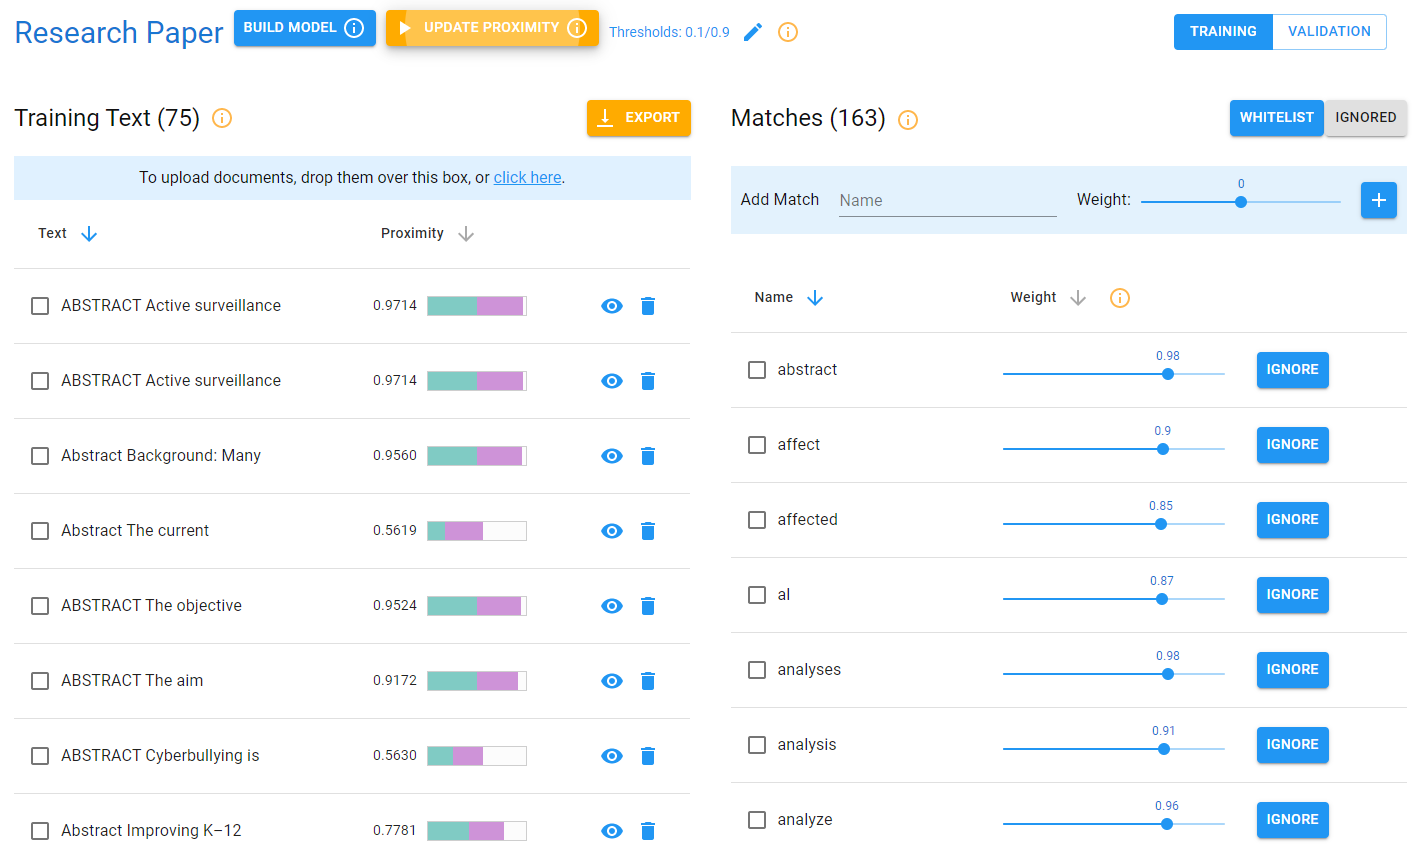
As of now, you have the research paper classifier model.
Note: There are 75 training texts. In order to begin the validation process, click on the validation button in the top right corner of the screen.
Step 1: Upload negative and positive validation documents
In order to upload your positive and negative validation documents, you must first create both a positive and a negative validation set. To do this click on the + add set button in the center of the screen. For the first set, name it positive and leave the slider untouched - so the color is still blue. For the second set, name it negative and toggle the slider so it is grayed out as shown below. Click Add for both sets.
Next, we want to add the new positive and negative validation text documents to their respective sets. First, select the positive set so it is highlighted in blue, and upload your positive validation documents by clicking click here on the right side of the screen and selecting upload.
Do the same for the negative set and upload your previously collected negative validation test set in the same click here box. Note: Make sure to select the negative box so it is highlighted in blue.
Now we have both our positive and negative validation sets uploaded into Nuix NLP.
Step 2: Run the validation model
After completing step 1, click the Start Run button located at the top of the screen.
Step 3: Visualize validation
After running the validation, click the green visualize button at the top of the screen.
Once inside the visualization page, you will see the validation results.
At the top of the screen, you will be able to see a star rating that is based on the F-1 Score provided. The next set of metrics are the confusion matrix results which will be explained in the next step. At the bottom of the page, you will see two histograms, one for the positive validation text and one for the negative validation text. These histograms display the average proximity scores for both the positive and negative validation sets. By hovering over the different classes, you will see the proximity bins and the counts of documents in each bin.
Click on the histogram classes to display a list of the documents and their proximity values that fall within the selected bin.
From this side menu, click on the eye icon. That action will bring up the below page where you can select either process text or dismiss. Process text will instantly bring you to the text editor page and analyze the document you previously viewed. Dismiss will return you to the prior page (the visualized validation results).
Step 4: Interpret Results
Below you will see your validation results. At the top of this screen, you will find quality assurance scores. These scores include F1-score, recall, accuracy, precision, average positive proximity, average negative proximity, and optimal threshold. There are two histograms provided, one for the positive validation text and one for the negative validation text. These histograms display the average proximity scores for both the positive and negative validation sets. By hovering over the different classes, you will see the proximity bins and the counts of documents in each bin.
For more information about the results:
F1-Score: The overall performance rating is based on precision and recall.
Recall: The true positives are divided by the false negative plus the true positives [TP / (TP+FN)].
Precision: This is the ratio of the correct positive predictions to the total predicted positives [TP/(TP+FP)].
Accuracy: This is the ratio of the correct predictions to the total predictions made [TP/(TP+FP+TN+FN)].
Average Negative Proximity: The average proximity of negative testing text. This should be considerably lower than the average positive proximity.
Average Positive Proximity: The average proximity of positive training text. This should be considerably higher than the average negative proximity.
Optimal Threshold: The proximity cutoff that yields the best F1 score. Anything above this value should be considered a true positive, while anything below should be considered a true negative.