The Nuix Adaptive Security application interface
After you log into the application, a Dashboard with the latest alerts appears.
Main navigation bar
The buttons found in the main navigation bar provide easy access to configurations and monitoring.
These buttons also allow for interaction with the data being collected, as described in the following table.
| Description |
Function |
|
|
|
Provides a visual summary of alerts and activity in the environment. |
|
|
|
Displays all alerts from the endpoint agents. |
|
|
|
Manage, configure, and schedule collections. Run targeted collections to obtain specific files from endpoints across the network. |
|
|
|
Allows you to find specific information within the Adaptive Security application. |
|
|
|
Provides easy access to the information collected from the endpoint agents. |
|
|
|
Access and manage endpoint agent configuration including logic rules, namespaces, and hash lists. |
|
|
|
View, configure, and manage endpoints. View by groups, all hosts, or server hosts. |
|
|
|
Shows the list of tasks created on all the endpoints. |
|
|
|
Provides the system settings, server, and preferences. |
|
|
|
Provides information about the currently logged-in user, including the user name, server address, server status, and the application version. |


The following sections provide an overview of each of the following tabs in the application.
Dashboard
The Dashboard tab, shown in the following image, provides quick access to the most relevant alerts, endpoints, and activity in your deployed environment.
The top of the application has arrows for use in moving back and forth between previously viewed tabs. Clicking the magnifying glass displays the Search dialog box.
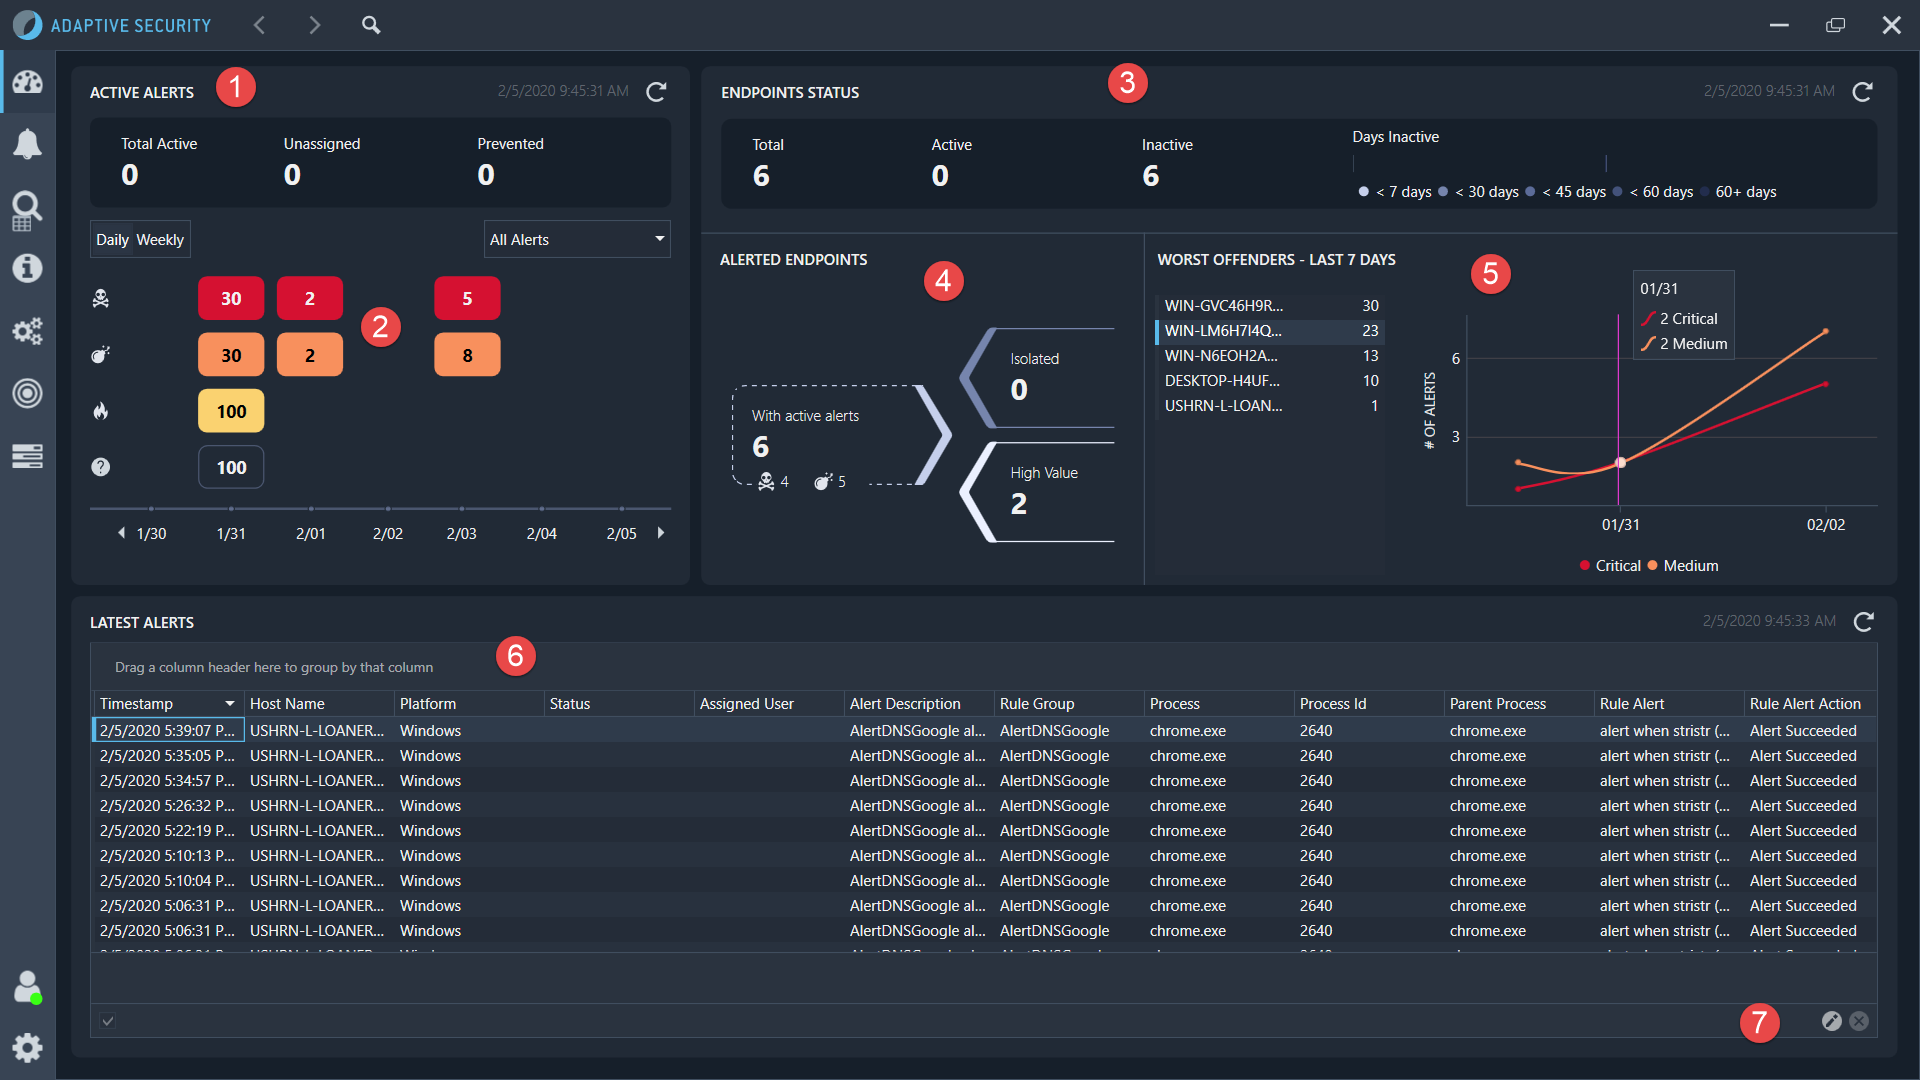
The information and functions that are available on this tab are described in the following table.
| Number |
Function |
Description |
| 1 |
Active Alerts |
Provides a visual representation of the alerts generated, using the following categories: Total Active: Lists the total number of alerts on endpoints with a status of Active. Unassigned: Lists the total number of unassigned alerts. Prevented: Lists the total number of alerts that resulted in a process being blocked. |
| 2 |
Active Alerts History Chart |
Provides a chart that displays the alerts in the following categories: Critical, Medium, Low, and Unknown. The number in the chart represents the number of alerts for the category. Clicking on a box opens the Investigate page, with the insight displayed depending on the category selected. The alerts can be displayed by Daily or Weekly, depending on the button selected. The alerts list can also be set to show All Alerts or Assigned to Me, depending on the alerts list option selected. Use the arrows on the time at the bottom to change the time period forward or backward from the date displayed. |
| 3 |
Endpoints Status |
Displays a list of the number of endpoints listed in the following categories: Total, Active or Inactive. To the right of this list is a chart that displays how long an endpoint has been inactive. The longer an endpoint is inactive, the darker the color in the graph becomes. |
| 4 |
Alerted Endpoints |
Displays a visual representation of the endpoints with the following categories. With active alerts: Lists the number of endpoints with active alerts. Clicking on the Critical or Medium buttons displays these alerts on the Investigate tab. Isolated: Lists the number of isolated endpoints. If there are any isolated endpoints, the arrow is red. High Value: Lists the number of endpoints in the High Value group. |
| 5 |
Worst Offenders - Last 7 Days |
Displays a list of the number of alerts generated by each endpoint, with the endpoint generating the most alerts at the top of the list. The chart to the right of the list displays the Critical and Medium alerts over the last seven days. |
| 6 |
Latest Alerts |
Provides a list of the recent alerts Nuix Adaptive Security has captured. Each column can be reorganized using the menu that appears when right-clicking on an alert. Data can be reloaded using the Refresh button, which is set to Disabled by default. |
| 7 |
Filter Editor |
(Optional) Allows you to create a query to modify the data shown in the Latest Alerts section. The query being used is shown on the left side. Click the X to stop using a specific query. |
Alerts
The Alerts tab, shown in the following image, lists alerts generated by Nuix Adaptive Security. The alerts are generated by the logic rules in the agent that are executed on the endpoint. Alerts are notifications that specific events occurred on the endpoint.
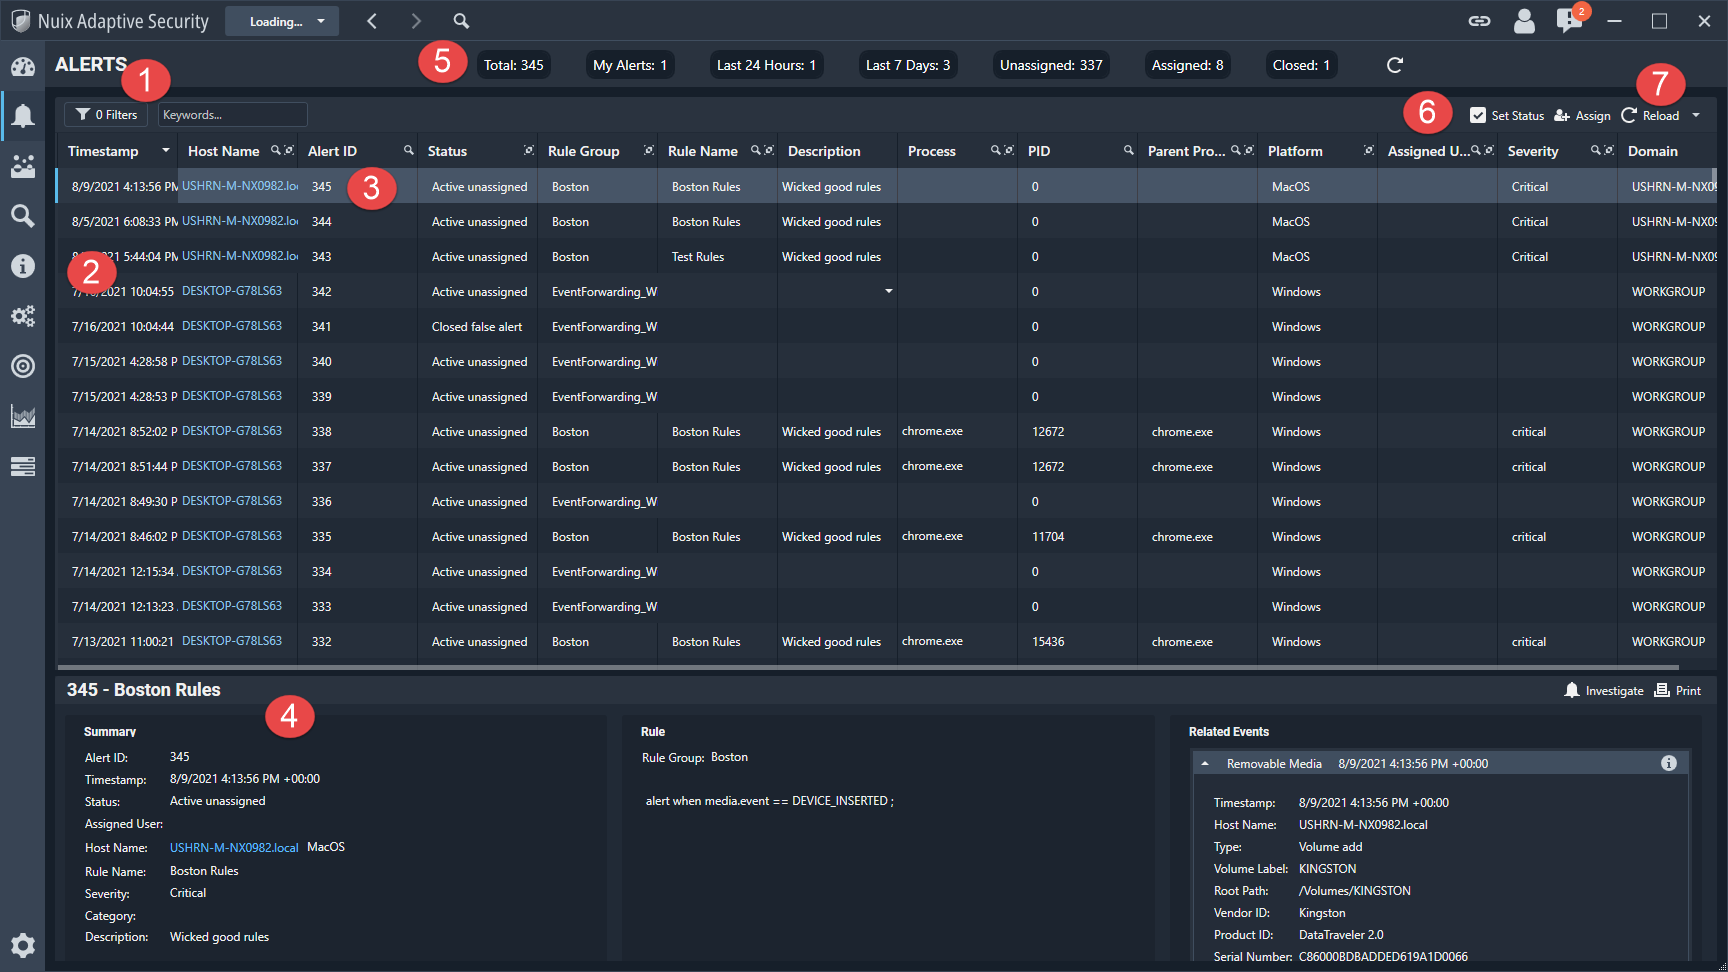
The information and functions that are available on this tab are described in the following table.
| Number |
Function |
Description |
| 1 |
Filters |
Use the filters to refine the data using the following: Quick Filter, Date Range, Assigned, Status, Endpoint, and Keywords. Click Hide/Show Advanced to make the advanced filters options appear or disappear. Click the pin at the top to make the tab auto-hide. Click the pin again to make the tab not auto-hide. |
| 2 |
Results |
Use one of the Sort by filters. Click Show in Groups in combination with any filters to group the results. The results can be shown in ascending or descending order. |
| 3 |
Alert |
This is one of the individual alerts in the list. |
| 4 |
Detail |
Shows the detailed information for the alert selected on the alert list. The information is presented in the following categories: Summary, Rule and Related Events. Summary shows the metadata information for an alert if there is any available. You can also investigate or print the alert. |
| 5 |
Categories |
Shows alerts by the categories listed. |
| 6 |
Toolbar Options |
On the right side of the tab, use the following options for each: Change Alert Status Assignment options |
| 7 |
Reload |
Updates the data in Nuix Adaptive Security. Data can be reloaded using the Reload button, which is set to Disabled by default. |
Collections
The Collections tab, as shown in the following image, is where you can manage, configure, and schedule collections in the Nuix Adaptive Security application. Run targeted collections to obtain specific files from endpoints across the network. Types of targeted file collections include:
Incident Response Collection
Browser History Files
User Documents
Email Stores and Archives
All Image and Media Files
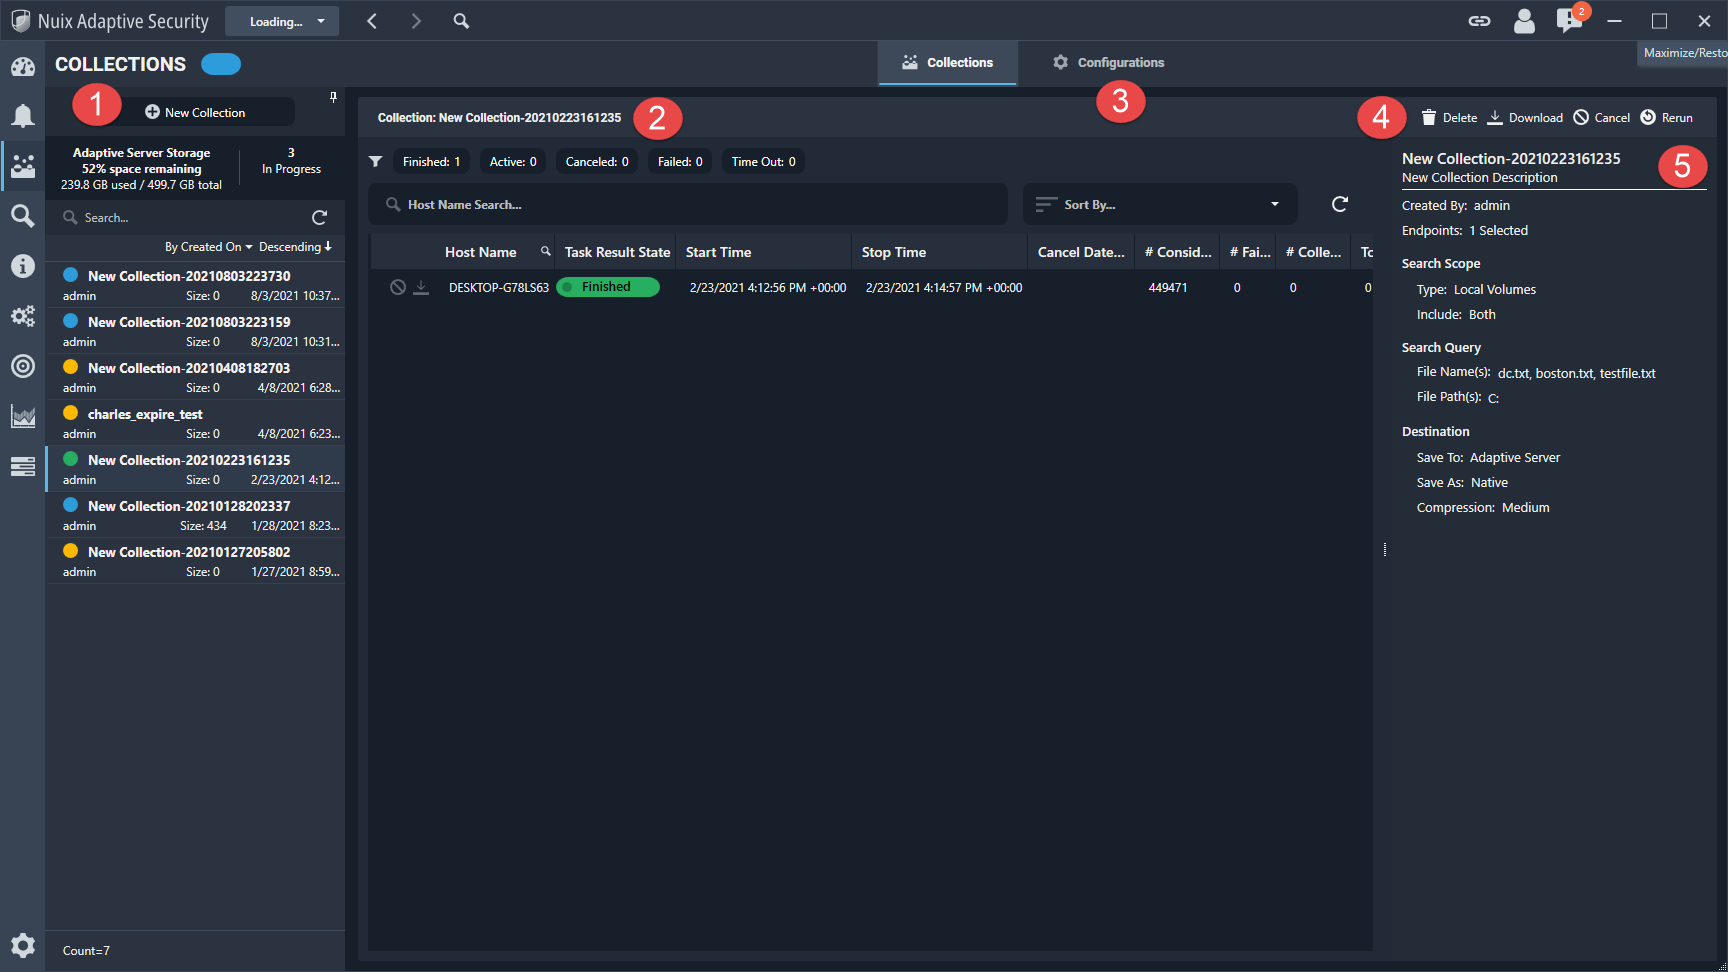
The information and functions that are available on this tab are described in the following table.
| Number |
Function |
Description |
| 1 |
Collections Explorer |
In the Collections Explorer, you can do the following: + New Collection: Create and run a new collection. Adaptive Server Storage: View the available server storage. In Progress: View the number of collections in progress. Search: Search for saved collections. |
| 2 |
Collections List |
In the Collections List, you can do the following: View collection status: The status options include Finished, Active, Canceled, Failed, and Timeout. Search: Search for collections using the host name. Sort by: Filter collections based on specified criteria. |
| 3 |
Configuration Wizard |
Create configurations using the Collection Configuration Wizard. The configuration acts as a template for the collection. The configuration defines what you are searching for and how you want to search during a collection. |
| 4 |
Collections Toolbar |
On the Collections Toolbar, you can delete, download, cancel, and rerun the selected collections. |
| 5 |
Configuration Details |
In the Configuration Details, you can view the selected host’s Collection Configuration details. |
Search
The Search tab, shown in the following image, lets you find specific information by searching for files, endpoints, or processes.
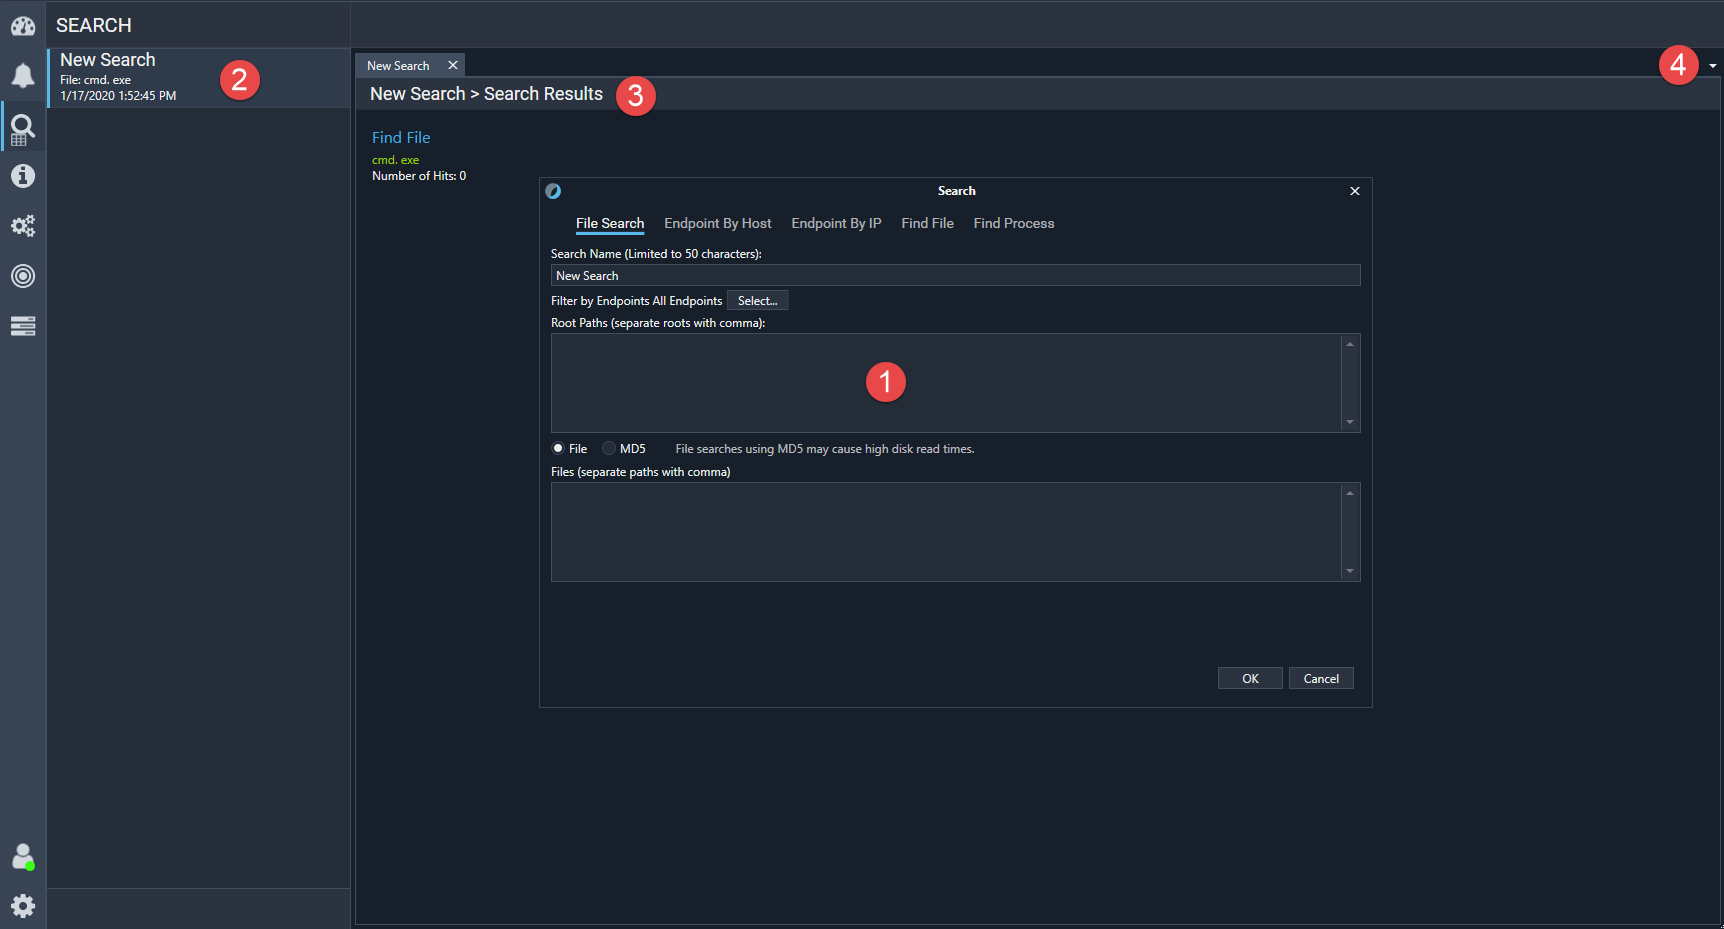
The information and functions that are available on this tab are described in the following table.
| Function |
Description |
|
| 1 |
Search dialog box |
Use this box to create searches for the following criteria: File Search, Endpoint By Host, Endpoint by IP, Find File, and Find Process. Search names are limited to 50 characters. |
| 2 |
Recent Searches list |
The list of previous searches. |
| 3 |
Search Results |
Clicking a search in the Recent Searches list on the left side shows the search criteria on the right side of the tab. To see the results, click the search tab. |
| 4 |
Tabs list |
Use this menu to select which of the tabs appears. The tab being viewed is marked with a check mark. |
Investigate
The Investigate tab, shown in the following image, is used to examine data and data sources in more detail.
The tab also has an area that gathers your investigations in one place.
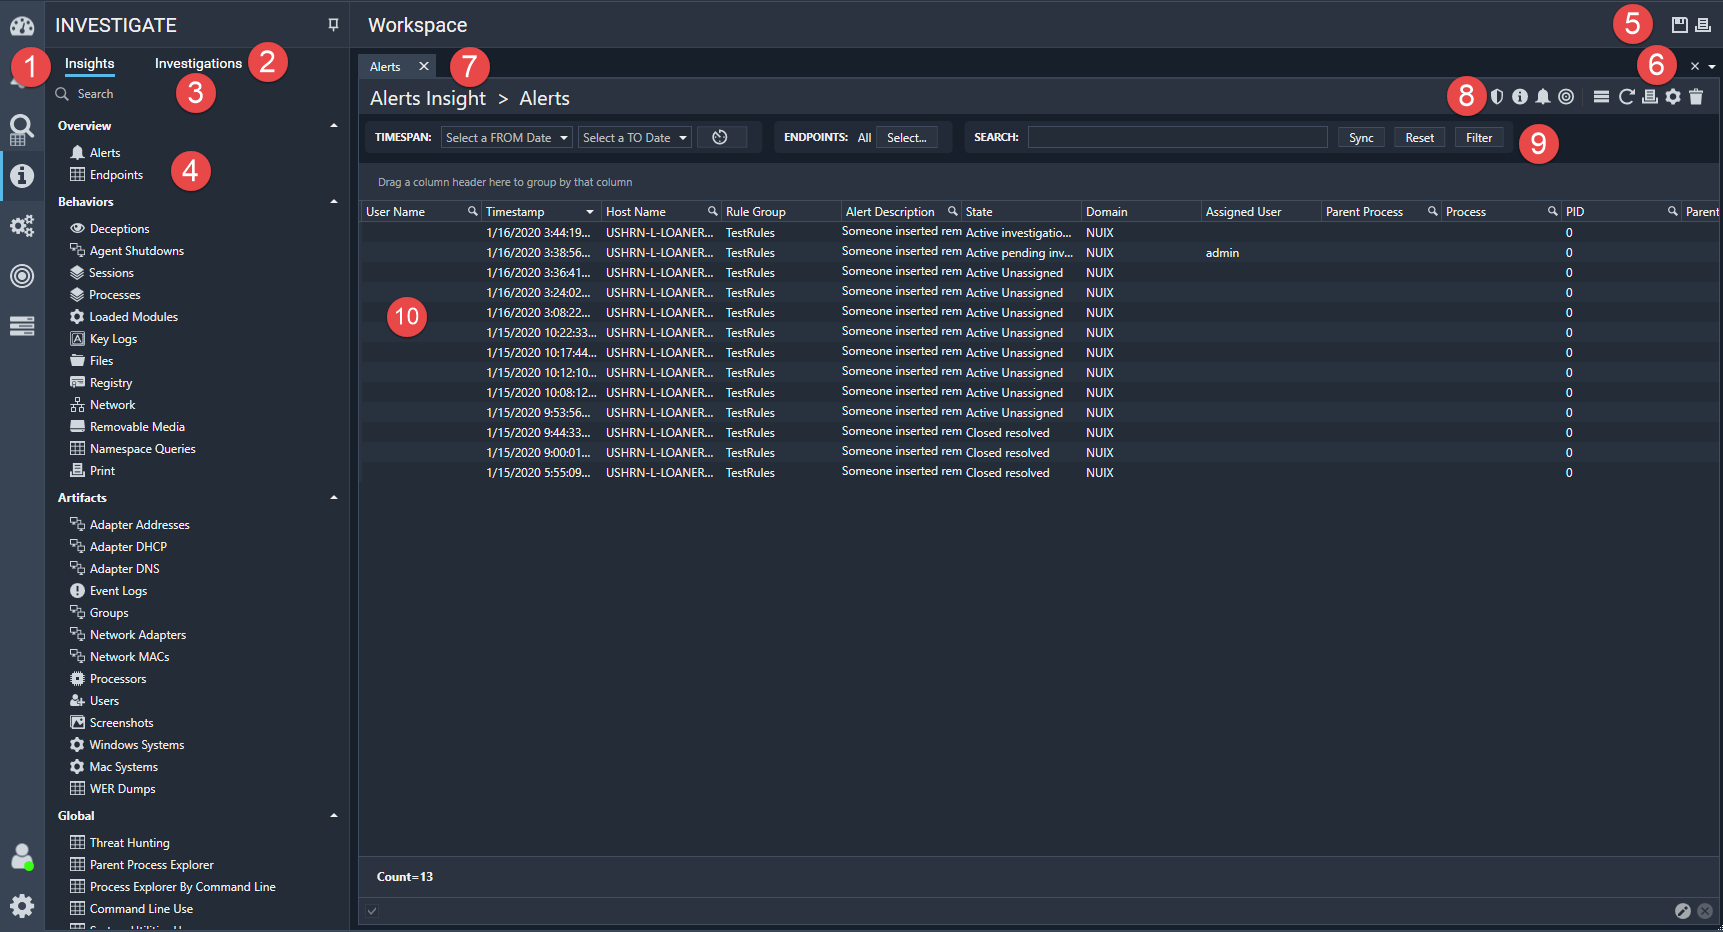
The information and functions that are available on this tab are described in the following table.
| Function |
Description |
|
| 1 |
Insights tab |
Click an Insight data source to further examine the source on the tab on the right. Click the pin at the top to make the tab auto-hide. Click the pin again to make the tab not auto-hide. |
| 2 |
Investigations tab |
Collect all your Investigations in one place. Click an Investigation to display that Investigation on the tab on the right. Click the pin at the top to make the tab auto-hide. Click the pin again to make the tab not auto-hide. |
| 3 |
Search bar |
Search for an insight name. |
| 4 |
Insights |
These are divided into three categories: Overview Behaviors Artifacts These data sources are categories built into Nuix Adaptive Security to allow for better organization of data. |
| 5 |
Investigations and Workspace options |
Open Insights can be saved or printed: Save Insights to New or Existing Investigation: Saves selected tabs in the Workspace to a new or Existing investigation. Print workspace: Prints the open tabs from the workspace. |
| 6 |
Tab control |
Use this menu to select which of the tabs that are open is to be viewed on the right tab. The tab being viewed is marked with a check mark. Close all tabs by clicking the X. |
| 7 |
Tabs |
Use the tabs to switch between open Insights. |
| 8 |
Menu options |
On the right tab, switch to the following for each Insight or Investigation: Microsoft Defender status Investigate Alerts (available when using Alerts insight) Endpoint actions Expand row height Refresh data Grid settings View delete |
| 9 |
Filters |
Adjust the Timespan by clicking a Start Date or End Date. Use the clock button to select a quick timespan. Use the default of All endpoints or use Select to select an Endpoint from the list. Enter a term in the search bar to find the term within the data on the tab, and the results automatically adjust based on the input. Click Sync to synchronize the data across all the open tabs. Reset returns the data to its starting state. Filter is another way to initiate a search that does not use the automatic update feature. |
| 10 |
Grid data |
Information or data for a selected Insight or Investigation, shown in greater detail. |
Configuration
The Configuration tab, shown in the following image, defines the agent settings, logic rule set, namespaces, and hash lists.
Configurations are applied to connected agents through the Endpoints tab. The configuration can also be embedded into an agent installer through this tab by selecting Download Agent.
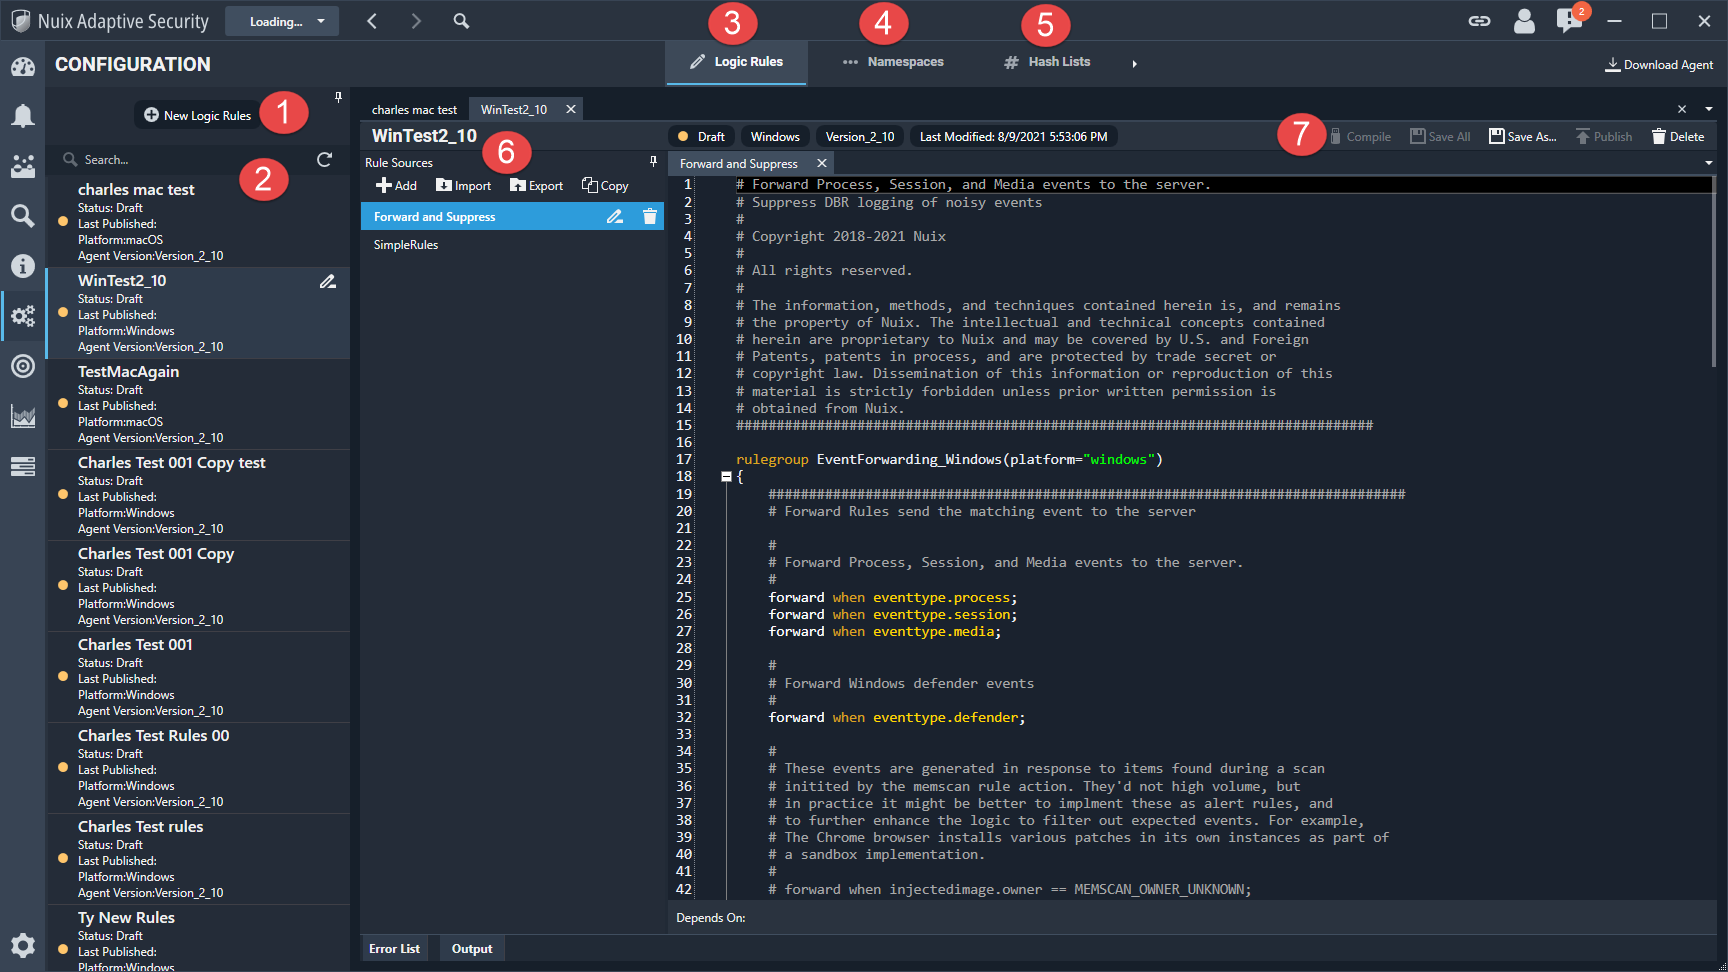
The information and functions that are available on this tab are described in the following table.
| Number |
Function |
Description |
| 1 |
New Logic Rules |
Use this option to create a new logic rule set. |
| 2 |
Configuration list |
Shows the list of the agent configurations. |
| 3 |
Logic Rules |
Logic rules are used to perform actions based on events generated by the endpoint. |
| 4 |
Namespaces |
Add the namespace filters. Order is important when setting up a namespace filter. |
| 5 |
Hash Lists |
Examine the available hash lists, add, or import hash lists. |
| 6 |
Creating or changing logic rules |
The Rule Sources includes the following options when working with rule sets: +Add Import Export Copy You can also rename or delete rule sets. |
| 7 |
Logic Rule Actions |
The following options are available when working with rules: Compile Save All Save As Publish Delete configuration record |
Endpoints
The Endpoints tab, shown in the following image, lists all Nuix Adaptive Security endpoints with an agent configured and installed. All endpoints are listed whether or not the agent is online with the Nuix Adaptive Security Endpoint Server.
You can view endpoints by group, all hosts, or hosts connected to the selected server.
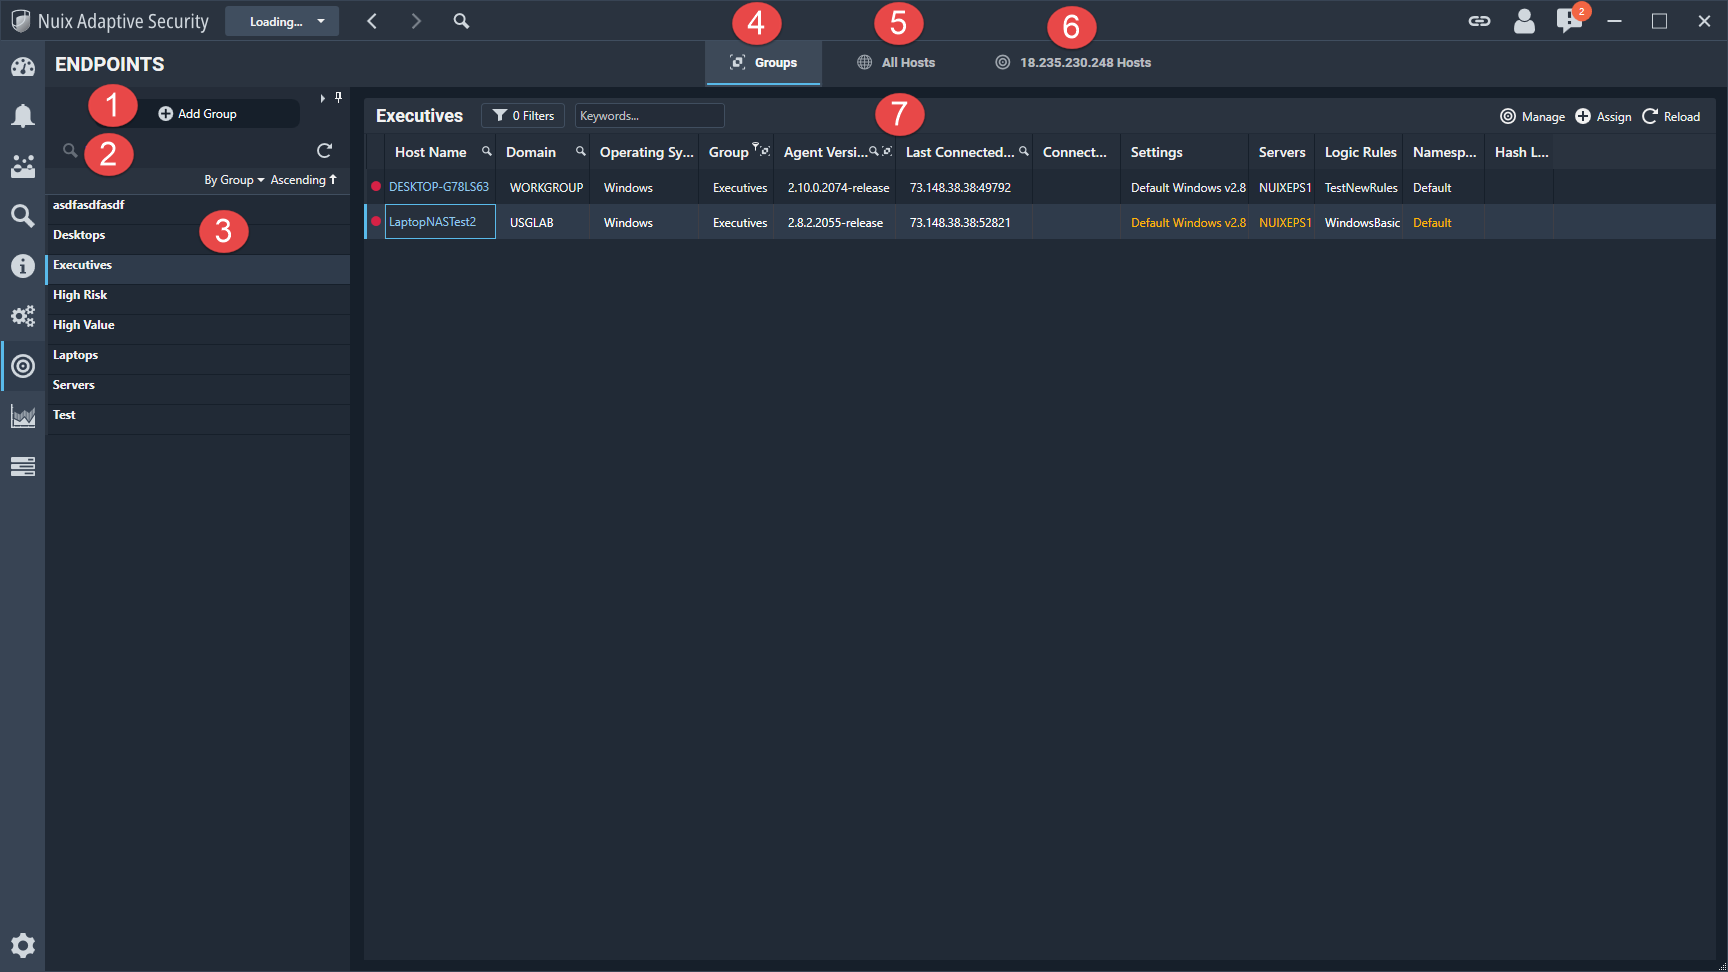
The information and functions that are available on this tab are described in the following table.
| Number |
Function |
Description |
| 1 |
Add Group |
Add a new endpoint group to categorize endpoints. |
| 2 |
Search |
Use the search to find a specific endpoint. |
| 3 |
Endpoint group list |
View the list of endpoint groups. Select a group to view the list of endpoints in that group. |
| 4 |
Groups |
View the endpoint groups details. You can select to view the groups in ascending or descending order. |
| 5 |
All Hosts |
View all hosts connected in your environment. Use filters to search for specific hosts. |
| 6 |
Server Hosts |
View hosts associated with a specific server. The list of endpoints in your Nuix Adaptive Security network. |
| 7 |
Group details |
Use the filters to refine the data using the following categories: Group By, Agent Versions, Platform, Settings, Servers, Rule Set, Namespaces, Hash List, and Keywords. Use Clear to clear the filters. Click Apply to update the lists of results based on the Filters or Keywords box. Click Advanced to use Boolean operators. |
Endpoint details
View the endpoint details, as show in following image, for more information about the endpoint.
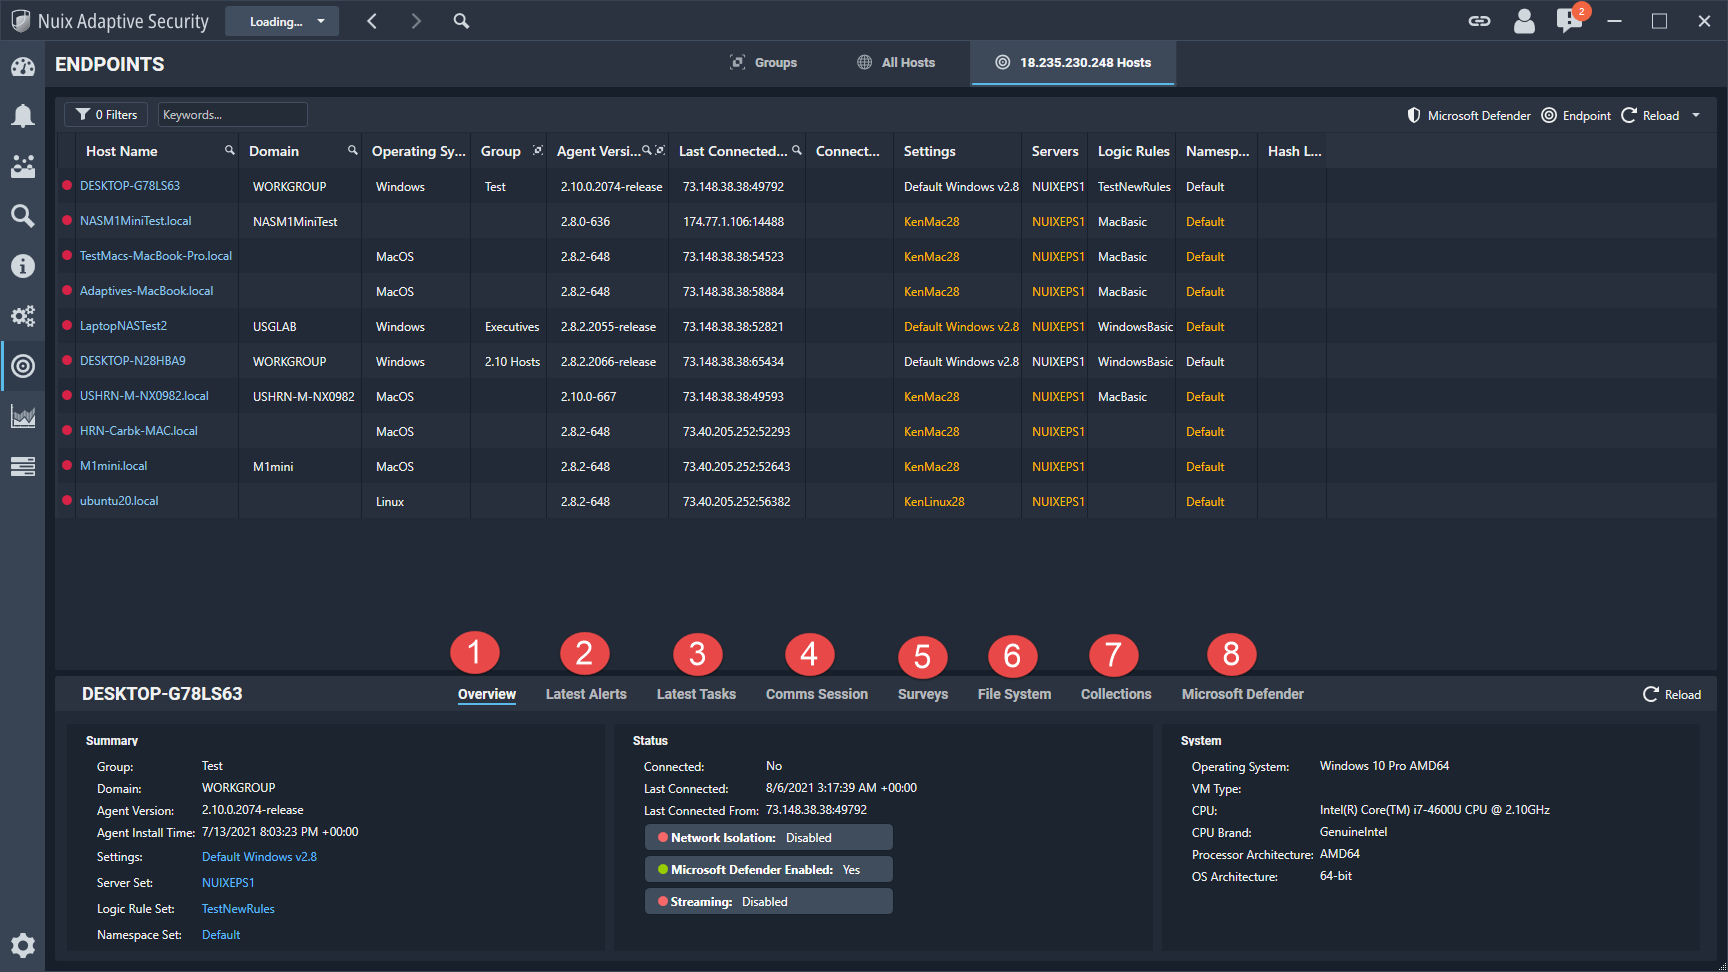
The information and functions that are available on this tab are described in the following table.
| Number |
Function |
Description |
| 1 |
Overview |
Provides general information for each endpoint. The information on this tab is divided into five separate categories: Summary: Summarizes information relating to the endpoint and its use of the Nuix Adaptive Security Endpoint Agent. Status: Displays the status for Streaming, Network Isolation, and Microsoft Defender for the selected endpoint. System: Provides information about the endpoint’s hardware and operating system. |
| 2 |
Latest Alerts |
Lists the latest alerts triggered by the endpoint. The alerts can be organized using one of the Sort by filters. Click Show in Groups along with any of these filters to group the results. The results can be shown in ascending or descending order. |
| 3 |
Latest Tasks |
Displays a list of completed tasks for the endpoint, with the most recent tasks shown at the top of the list. |
| 4 |
Comms Session |
Shows network data between the Nuix Adaptive Security Endpoint Server and the individual endpoint. |
| 5 |
Surveys |
Gives detailed information about an endpoint’s hardware and software configurations at a specific point in time. This contains the following tabs: Survey System Processors Firmware Logical Drives Adapters |
| 6 |
File System |
Displays the directory and file listing of the endpoint. Files can be downloaded, queried, or deleted by selecting the option from the context menu. Right-clicking on a column allows you to sort and make changes to how the data appears. |
| 7 |
Collections |
Displays the active and completed collections for the selected endpoint. |
| 8 |
Microsoft Defender |
Displays whether Microsoft Defender is enabled or disabled on the endpoint. |
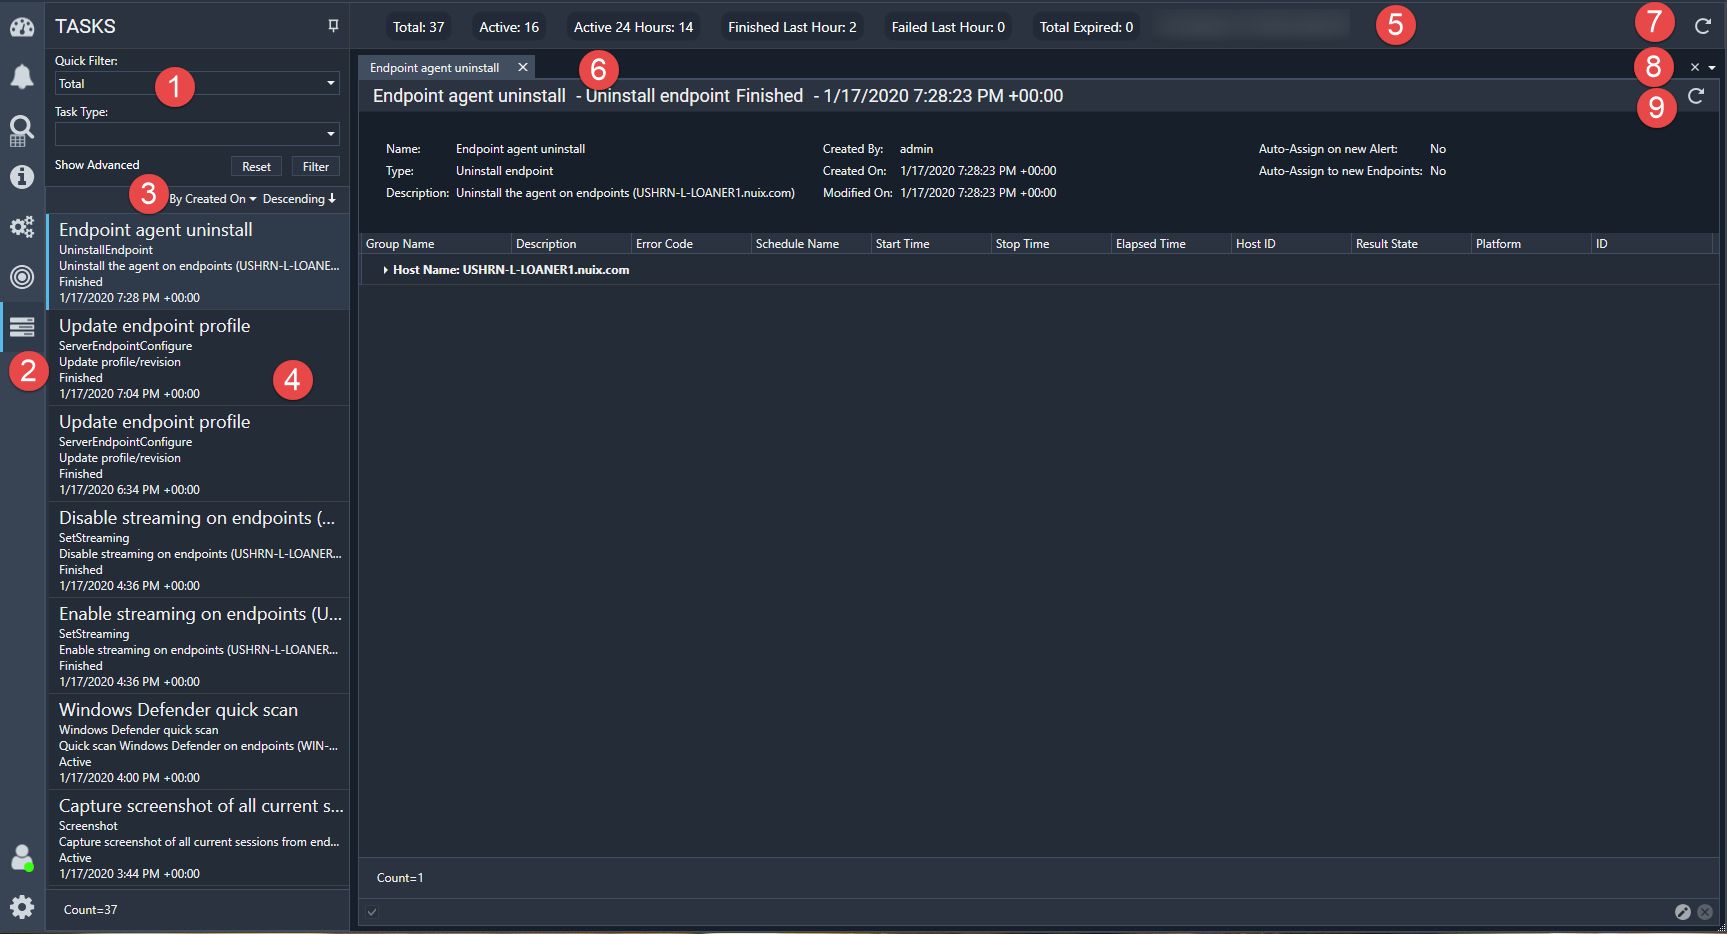
Tasks
The Tasks tab, shown in the following image, lists all jobs that have been created for the endpoints on the network.
The information and functions that are available on this tab are described in the following table.
| Number |
Function |
Description |
| 1 |
Filters |
Use one of the following filters in the Tasks list: Quick Filter, Task Type, Date Rage-From Date and To Date, Endpoints, and Keywords Click Reset to return the data to its original presentation. Click Filter to filter tasks according to the selected filter criteria. Click Hide/Show Advanced to make the advanced filters options appear or disappear. |
| 2 |
Task notification |
A number appears when a new Task is added. This notification appears if any other tab is open besides Tasks. |
| 3 |
Results |
Use one of the Sort by filters to change the sort order of the tasks. Click Show in Groups in combination with any of these filters to group the results. These results can also be organized in ascending or descending order. |
| 4 |
Task Summary |
Lists all the tasks meeting the criteria of the advanced filters. |
| 5 |
Categories |
Shows tasks by the categories listed at the top of the window: Total, Active, Active 24 Hours, Finished Last Hour, Failed Last Hour, Total Expired. |
| 6 |
Task details tab |
The detail for the task selected on the left side appears on the right side of the tab. Multiple tabs can be open at the same time. |
| 7 |
Reload |
Data can be reloaded using the Reload button, which is set to Disabled by default. |
| 8 |
Tabs control |
Use this menu to select which of the tabs that are open is to be viewed on the right tab. The tab being viewed is marked with a check mark. Close all tabs by clicking the X. |
| 9 |
Reload |
Click to reload the task information. |
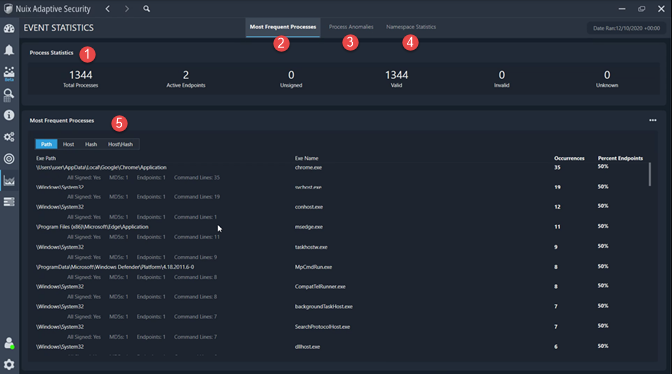
Event statistics
The Event Statistics, as shown in the following image, is where you can view daily event details about the endpoints in your environment.
The information and functions that are available in this module are described in the following table.
| Number |
Function |
Description |
| 1 |
Process Statistics |
The Process Statistics header displays the overall process event counts for the connected endpoints during the previous day. |
| 2 |
Most Frequent Processes |
Most Frequent Processes displays four reports describing the frequency of the process event paths. By default, the reports display the most frequent 100 paths and the least frequent 100 paths. |
| 3 |
Process Anomalies |
Process Anomalies displays five reports describing the frequency of the process event command lines. By default, the reports display the most frequent 100 paths and the least frequent 100 paths. |
| 4 |
Namespace Statistics |
Namespace Statistics displays four reports describing the frequency of DNS namespace queries. |
| 5 |
Report Details |
The report details will vary depending on the selected event category. Most Frequent Processes reports: Path - Occurrences of paths from all connected endpoints. Host - Occurrences of paths for each endpoint. Hash - Occurrences of paths grouped by the MD5 hash value of the executable. Host/Hash - Occurrences of paths grouped by both the endpoint and the MD5 hash value. Process Anomalies reports: Command Line - Occurrences of command lines from all connected endpoints. Hash - Occurrences of command lines grouped by the MD5 hash value of the executable. Parent Path - Occurrences of command lines grouped by both the MD5 hash value of the executable and the full path of the parent executable. Host/Command Line - Occurrences of command lines per each endpoint. Host/Hash/Command Line - Occurrences of command lines grouped by both the endpoint and the MD5 Hash value of the executable. Namespace Statistics reports: Query - Occurrences of DNS queries from all connected endpoints. Host - Occurrences of DNS queries grouped by endpoint. Process - Occurrences of DNS queries grouped by process full path. Process/Host - Occurrences of DNS queries by both endpoint and process full path. |
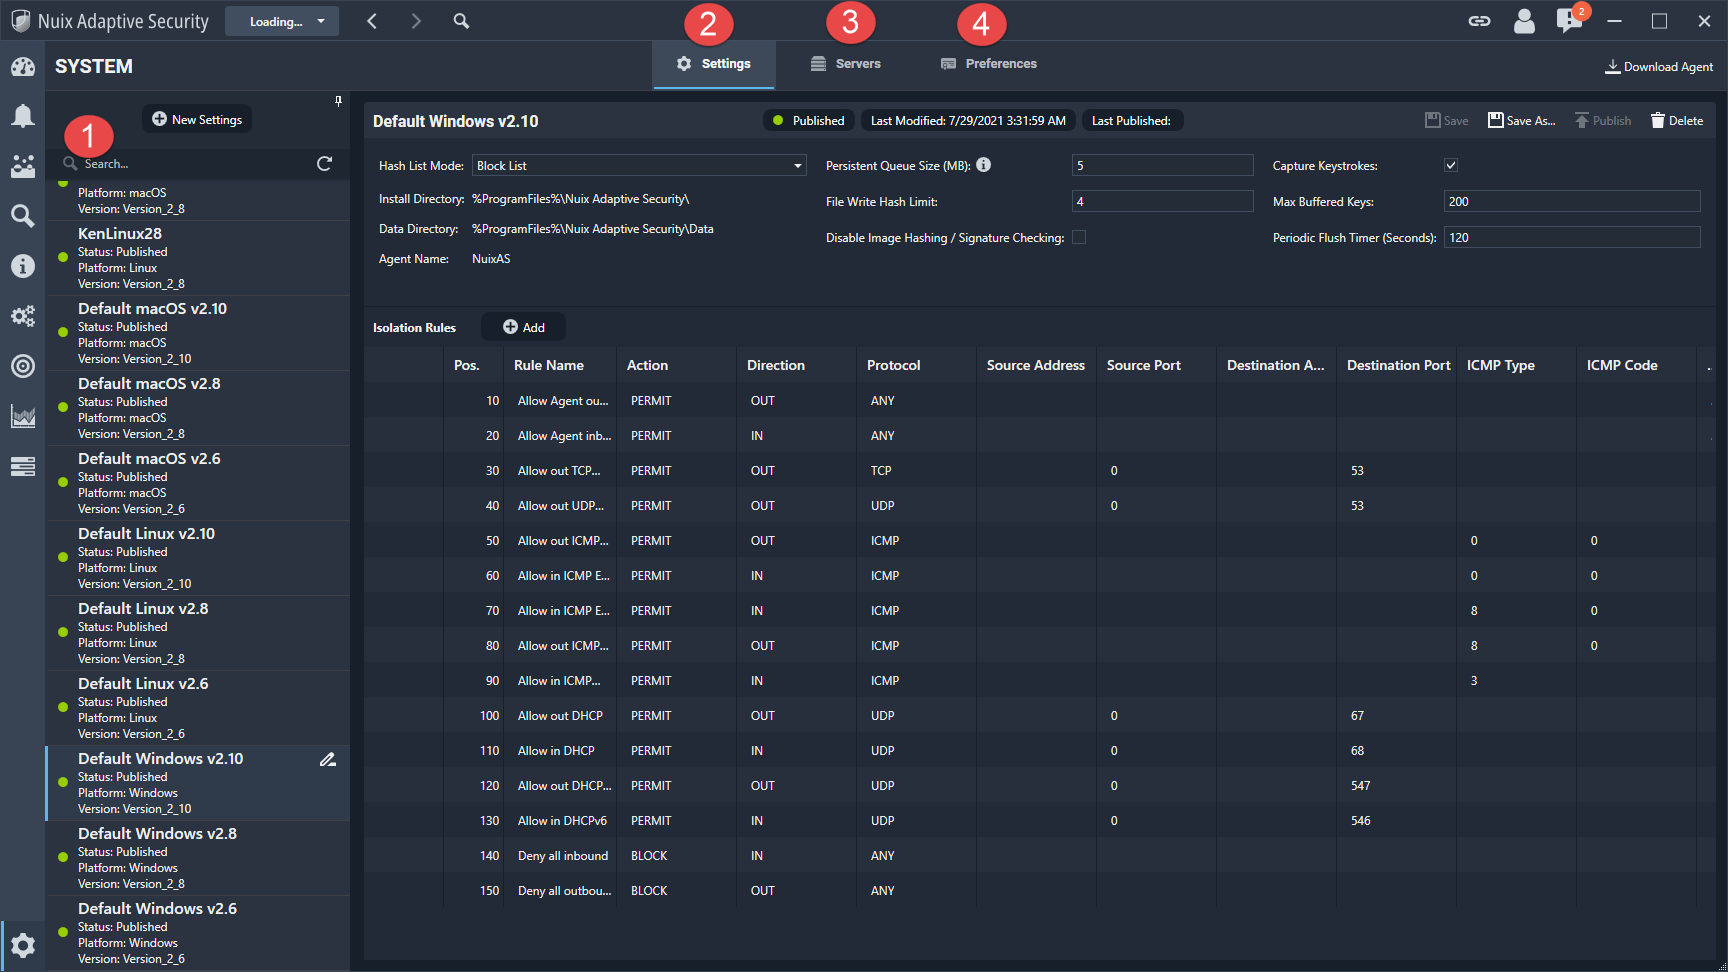
System
The System tab, shown in the following image, contains information about settings, servers, and preferences.
The settings tab provides the static configuration settings for the agent. This is typically set up during the installation process.
The servers tab is where you can view all of the Nuix Adaptive Security endpoint servers in your environment. You can also add, edit, or delete servers on this tab. This is where you add a server for redundancy, as a DMZ, or for backup. This is not where you add servers for a multiple server environment which is done during the installation process.
The preferences tab contains information about local storage and your version of Nuix Adaptive Security.
The information and functions that are available on this tab are described in the following table.
| Number |
Function |
Description |
| 1 |
Agent Settings list |
In the agent settings list you can do the following: Create + New Settings with the name and target version. View the published and draft setting versions with the platform and version. Select a setting to view the details. |
| 2 |
Settings |
The Settings tab provides the static configuration settings for the agent. This is typically set up during the installation process. |
| 3 |
Servers |
The Servers tab is where you can view all of the Nuix Adaptive Security endpoint servers in your environment. You can also add, edit, or delete servers on this tab. This is where you add a server for redundancy or backup. This is not where you add servers for a multiple server environment. |
| 4 |
Preferences |
Click Clear Local Storage to remove any values stored locally, including those listed in the infotip, which are: Workspace insight tabs Items on the login screen Layout customizations Recent searches View the About information which includes the application version, hardware key, and license status. Set screen user preferences. |
User profile
The following information is available by clicking the user information icon, as shown in the following image.
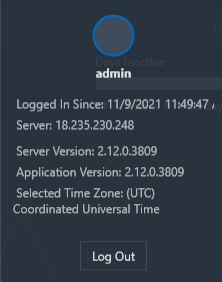
User Name: The name of the user who is logged in to Nuix Adaptive Security.
Logged In Since: The timestamp of when the user first logged in.
Server: Lists the IP address of the Nuix Adaptive Security Endpoint Server.
Server Version: Displays the software version for the Nuix Adaptive Security Endpoint Server.
Application Version: Displays the software version of Nuix Adaptive Security application.
Selected Time Zone: Displays the time zone.