Context tab
Use the Context tab to visualize the data links between files in the case. It provides data links between files in the form of interactive visuals allowing easier identification of patterns and trends in the data and helps you identify anomalies relevant to the investigation.
Digital investigations are primarily based on keyword searching. Data linking provides a powerful investigative method by finding the relevant pieces of data in the case and then identifying other associated pieces of data missed until the complete view of the digital evidence is visible. This is important for incident response or breach investigations where attackers attempt to hide the presence of malware on the system. Being able to start with a few data points and casting the net wide, by looking for common visual links across the network is a great way to identify indicative signs of compromised systems.
Being able to compound new Nuix Workstation cases with existing ones also means that you can follow intelligence data links between previously unlinked cases revealing previously unknown evidence.
This section covers:
How to open a new Context tab
Analysis Graph window
Analysis Table window and its right-click commands
More Context tab options from the Global Options window Also see Analyze evidence for further information.
Open a new Context tab
To open a new Context tab:
Navigate to Window and select New Context Tab.
In the Results pane, select the items to display on the Context tab and select Show, then Show in Context from the right click menu. The Context tab consists of the Analysis Graph window and the Analysis Table window.
Analysis Graph window
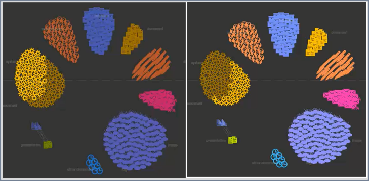
The Analysis Graph visually displays items differentiated by color in freeform islands of data or distributed across a data timeline.
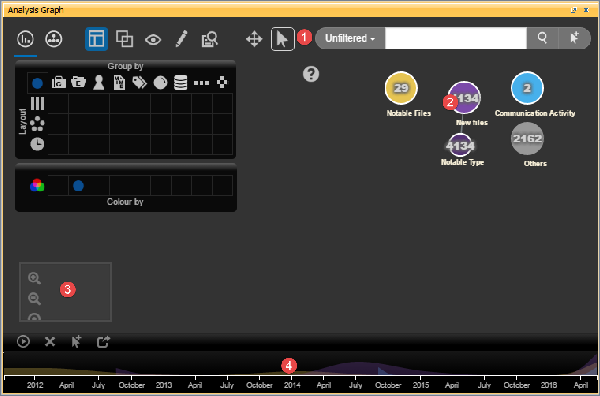
The Analysis Graph window comprises the following elements:
Graph toolbar
Graph
Magnification toolbar
Timeline bar
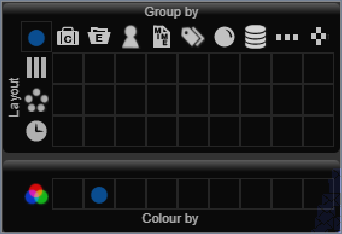
Graph toolbar
The following table details the layout, view, and other quick-access controls you can use in the Graph toolbar.
| Option |
Action |
|
|
Click to display a layout matrix. Use it to select layout and grouping options; and colors to represent different nodes.
Enabled by default, the Free option enables you to view items in free form, disregarding groupings and applying a force-layout over the items. |
|
|
Click to display the evidence in a Geographic view on a global map, allowing you to examine the connections. |
|
|
Click to display the evidence in a Network map, allowing you to examine the connections. |
|
|
Click to make the layout matrix static. |
|
|
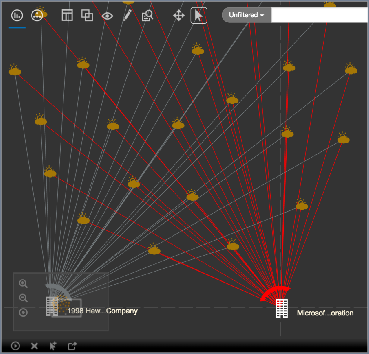
Click to select one of the following ways to view your selected items: Selected: To view the vertices as Grid, Vertical, Horizontal. Focused: To focus on a vertex and view related nodes or layout-related nodes. Radial: To view the items linked to the selection diverge in lines from a common center. Entities that are not present in any selected item are greyed out and revert to Entity item counts in the menu.
Waterfall: To view the items linked to the selection appear in steps.
Pin: To anchor the nodes to the graph. Unpin: To remove the anchor from the graph. |
|
|
Click to show or hide the following for the selected vertices: View: To view Edges, Labels, and Chords. Hide: To hide or display the selected nodes or edges. Select: To select all or invert the view of the selected vertices. Linked: To show the next level of linked items to the selected bubble by selecting Linked, Linked +1, Linked +2, or Orphans. Theme: To toggle between the dark and light themes.
|
|
|
Use this tab to manage the vertices and edges. Select: Add/Edit Vertex: To add or edit a vertex. The Display text is the label that appears in the Context graph: GUID (system generated unique ID). Type of vertex: To search and retrieve all items of a similar type, using the Vertex date or a description. Add/Edit Edge: To add or edit edges (like linking items). To add an edge to two items, select the items, click Add Edge, enter the label, and click Add to link the two vertices. Push to Graph: To push the vertices and edges into the graph database; then click OK to confirm your action. |
|
|
Click to analyze the graph based on one of the following selections: Entities: To retrieve all the named entities related to the selected items. |
|
|
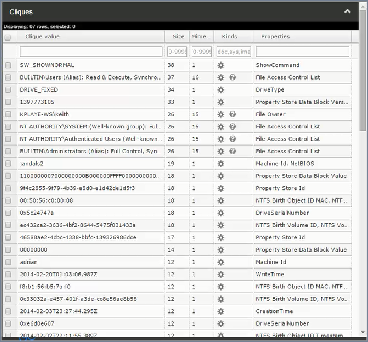
Cliques: To provide a table with detailed information on the cliques (how items are related by matching metadata values between items).
Items: To retrieve all items related to the selected named entities. Duplicates: To retrieve duplicate items from Nuix Workstation based on selected items' MD5. Bubbles: To investigate how items are linked and grouped in bubbles. Neighbours: To retrieve vertices from the graph database linked to the currently selected vertices. Linked Entities: To retrieve all linked items to entities (for example, emails with their associated attachments). |
|
|
Click to enable Pan mode so you can move the vertices in the Analysis Graph and adjust the screen by zooming. |
|
|
Click to enable 'Selection mode' so you can select a set of vertices in the graph. |
| Graph Search Bar |
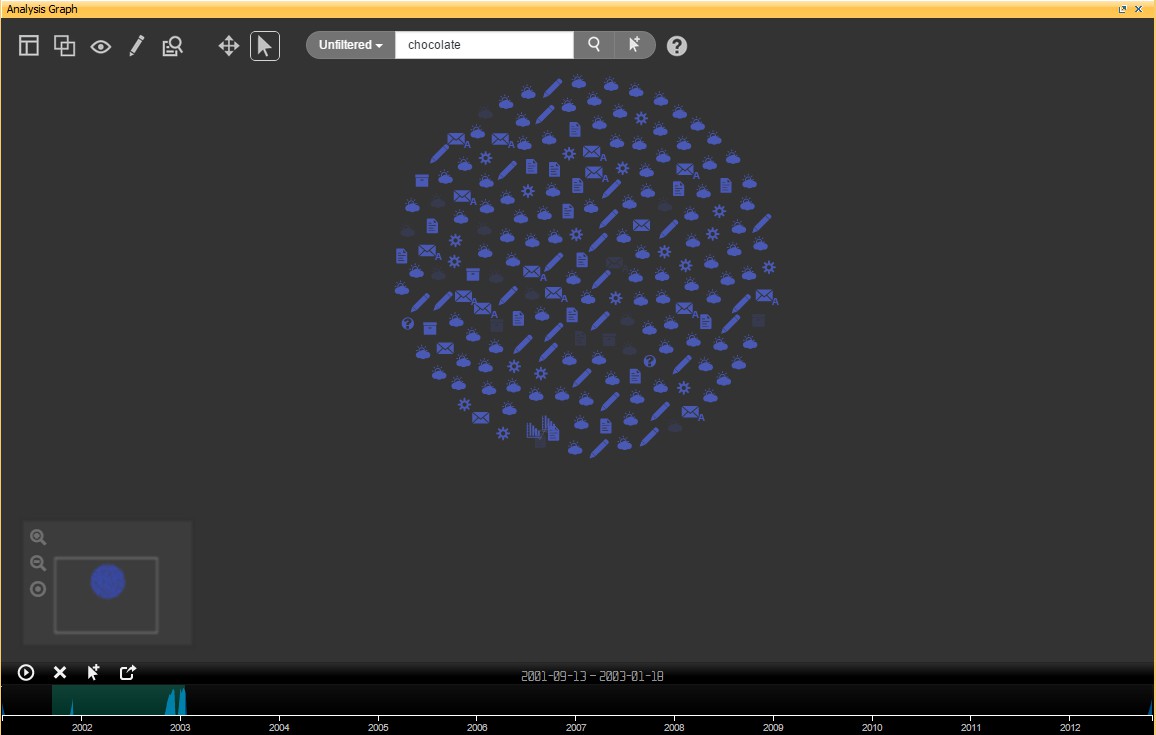
Use the search function as follows to highlight items in the graph based on the search entities: To retrieve the vertices from the graph database, click the Search icon. To filter items, enter a keyword and click Search. As you enter a term, the results automatically change to reflect the text you enter. To add matching items to the current selection, click the arrow after the Search bar. |
|
|
Click to use any of the following keyboard shortcuts: Ctrl: Hold to switch to pan mode. Shift: Hold to join selections to zoom in and out. Ctrl + A: To select all items. Ctrl + F: To find. T: To toggle text visibility. L: To toggle link visibility. M: To toggle the circular magnifier ON or OFF. Alt M: To toggle the Cartesian magnifier ON or OFF. R: To respawn the layout. Ctrl + R: To reload the graph. P: To play or pause the timeline. Esc: To cancel a long operation or reset the timeline or clear the selection. |


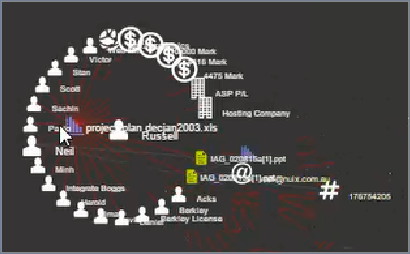
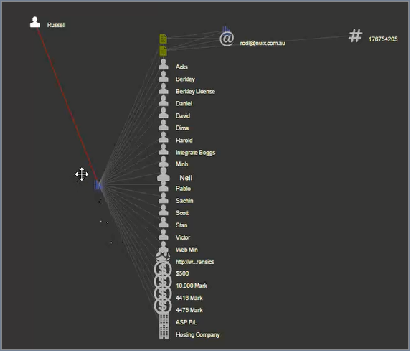


Graph
The graph displays the grouped items in bubbles. Right-click an item to expand and view it in detail.
The following table lists the right-click commands for each bubble. These options help you quickly analyze the graph in your desired view.
This visualization combines filtering, grouping, and linking items. It generates cliques of items that share similar properties. Common text strings are called 'cliques'.
| Option |
Associated functions |
| Analyze |
Entities: All or tagged. These can include: Company, Country, Email, IP address, Money, Person, Personal-ID-num, URL, Phone number, and custom-named entities. Items Cliques: Generates cliques of items for the following: Duplicates Bubbles Neighbours Children Linked Entities |
| Selection |
Include: All, Recently added, Linked, Linked +1, Linked +2 Tag Pin or Unpin Export Invert |
| Show in |
Context, Workbench |
| Edit |
Hide, Vertex, Edge, Re-tag bubbles, Import, Export, Push to graph |
| Layout |
All nodes Selected Focused Group by Colour by Re-optimize Show or Hide |
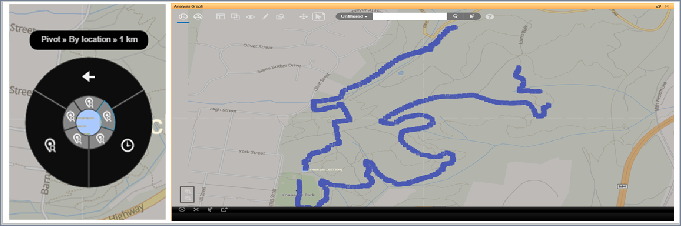
| Pivot |
Lets you view events occurring before or after you created the selected item: By time: Before or after: 30 sec, 1 min, 5 min, 10 min, 20 min, 1h, 1 day By location: From the Workbench and Context tabs. |
Note: Select a bubble and right-click anywhere on the Graph area to view the right-click menu. This helps to view the list clearly and does not truncate the list while viewing.
Analyze items by named entities
To visually analyze links between items and named entities, right-click items in the Context View, and use the options in the Context menu.
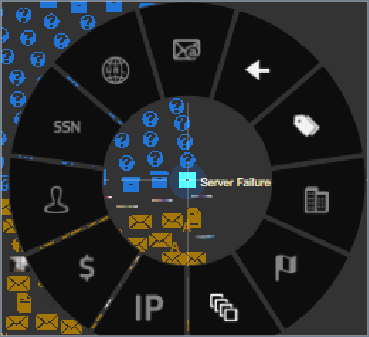
To analyze and display the relationships between items and named entities, right-click them in the Context View, and use options from the Entities menu.
View an item on an offline map with geo-coordinates
If working with offline maps, you can view the items on a map to track their geographical context. To view the item with geo-coordinates on a map:
Select the Context menu, then select Layout > All nodes > Geographic.
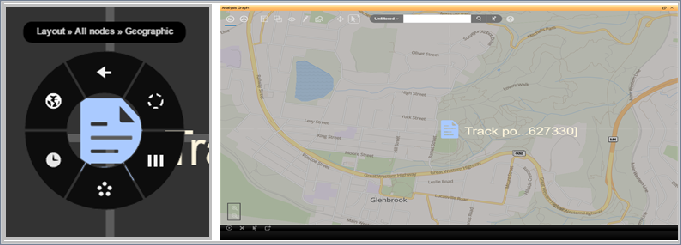
Then, pivot by location in the Context menu.
All responsive geo-items in that pivot range then appear.
Magnification menu
The Magnification menu shows your current position when you zoom into a graph. Then, click the following icons:
 : To Zoom in on the focused item.
 : To Zoom out of the focused item.
 : To Move the graph to the currently focused item.
Note: To pan the view, click inside the overview map and drag the map as required.
Timeline toolbar
The Timeline pane shows a wider and more detailed display of information. It allows you to go from the main screen into a selected date range on the Timeline bar for a more detailed view. The shadowed items indicate every Date property associated with an item.
The Timeline pane consists of a Timeline toolbar with the Timeline bar. To select a range in the timeline, click and drag the period on the timeline to highlight the controls in the Timeline toolbar.

| Control |
Action |
|
|
Click to Play or Pause the selection on the timeline. |
|
|
Click to Reset the timeline. |
|
|
Click to highlight the selection. |
|
|
The query for the current time range in the new Context. |


View the date range details in the section following the Timeline toolbar.
Analysis Table window and its right-click commands
The Analysis Table window lists every event as an event row in the search results. In this table:
To select an event row, click the Select button on the row.
To select all event rows, click the Select All button.
To select the column profile and sort the column, right-click an Analysis table heading.
The Date and Date Type columns are fixed and are not configurable. The following table lists the right-click commands options for a row or rows:
| Command |
Actions |
| Pivot |
Select one of the following: By time: 30 seconds, 1 minute, 5 minutes, 10 minutes, 20 minutes, 1 hour, or1 day By location: 100m, 1 km, 5 km, 10 km, or 100 km |
| Select All |
To select all the data in the Analysis table. |
| Select None |
To deselect all the data in the Analysis table. |
| Export |
Select either of the following: Export View, then Export to File or Export to Case Notes, and then select as needed any of the following: Export Items Export Logical Image Export Case Subset Export Annotations Export Digest List Export Shingle List Export Fuzzy Hash List Export Item Metadata Legal Export to and send to one of the following eDiscovery programs: Concordance, Discovery Radar, DocuMatrix, EDRM XML, EDRM XML/ZIP, Everlaw, iCONECT, InControl, IPRO, Relativity, Ringtail, or Summation. |
| Tags |
To add or remove tags. |
| Exclude Items |
To select items to exclude from a case. |
| Custom Metadata |
To add or remove Custom Metadata. To apply a template. |
| Custodian |
To assign or unassign a Custodian. |
| Show |
To show any of the following: Show All Children Metadata Show All Descendants Show All Top-Level Items Show All Families Show All Near-Duplicates Show All Chained Near-Duplicates Show in Context Show in Workbench Show in Database Viewer Show All Clustered Items |
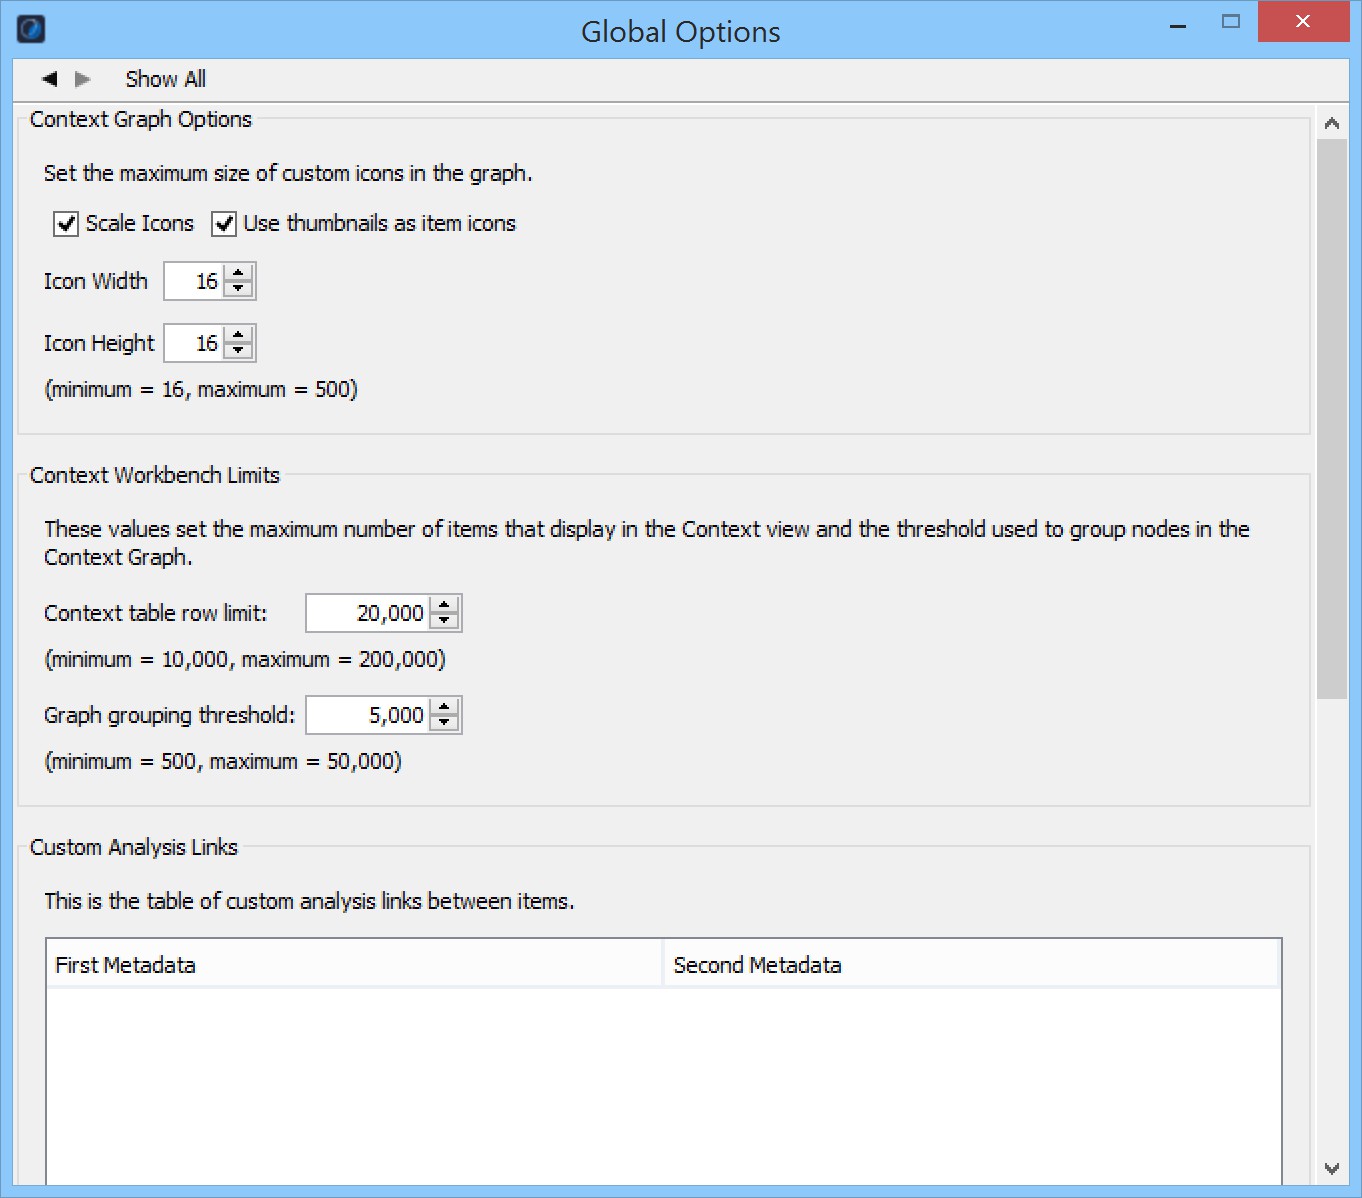
More Context tab options from the Global Options window
There are a number of additional options to display items on the Context tab, that you can set through the Global Options window.
Set Context tab display options
To set extra Context tab display options:
Select File > Global Options > Context.
On the window that opens, select the following as required:
Context Graph Options:
To either:
Select Scale Icons to set the width and height of custom icons in the graph using values between 16 and 500, or
Select Use thumbnails as item icons in the Context tab.
Context Workbench Limits: To set the maximum number of items to appear in the Context view by setting a Context table row limit and the threshold to group nodes in the graph.
Custom Analysis Links: To set and enable custom analysis links between items. For details, see Set and enable custom analysis links between items that follows.
Custom File Type Display Text: To add display text for vertices.
To set and enable custom analysis links between items
To add an item and define MIME-type metadata to automatically link the item in the Context Graph:
At bottom left of the preceding window, click the plus (+) sign to open the Analysis Links dialog.
Select a MIME-type and Metadata Group (Nuix-defined metadata, Communication metadata, or Properties).
Select a Metadata type from one of the Nuix-defined metadata fields.
Repeat this process to define second MIME-type properties.
Click OK to add the entry. The item is added to the list.
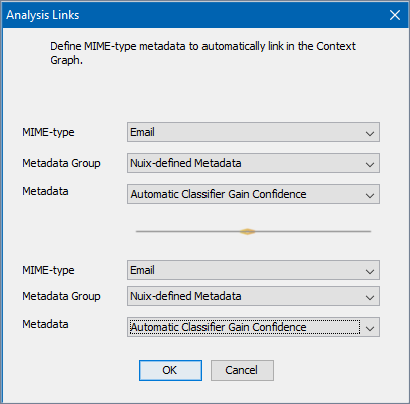
To edit that entry, select the item and click the Edit entry item icon to open the Analysis Links dialog; make your modifications and click OK to save your changes. To remove an entry, select the item and click the Remove icon.
To import or export the custom analysis links, click the Import/Export icon.
Link data
This option is available for licensed customers.
Data links are drawn between items in the case, based on the following four different methods:
| Data linking Method |
Description |
| Items with common Named Entities |
(Default.) Nuix Workstation’s built-in Named Entities include Credit Card Numbers, Email Addresses, IP Addresses, and more. |
| Items with Operating System associations |
A notable executable or document file may have an associated shortcut or link file, pre-fetch file, and or local access records. |
| Items with common key metadata |
This highlights links between duplicate files based on MD5 hash, filename, file-size, and also text shingles. |
| Items with common text strings (cliques) |
Groups of items with common useful text strings are grouped into cliques and links are established. |