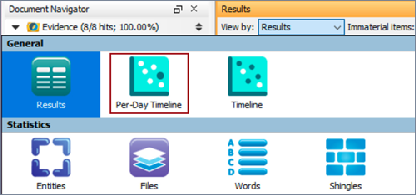
Use specialist views
This section covers the following topics which detail options for how to view a particular subset of your data for further investigation:
Use the Thumbnails view
Use the Per-Day Timeline view
Use the Timeline view
Use the Entities view
Use the Files view
Use the Addresses view
Use the Shingles view
Use the Words view
Use the Topics view
Use the Event Map view
Use the Network view
Use the Map view
Use the Charts view
See View items in the Results pane for how to do the following:
Use the Hide Immaterial Items option
Use the Deduplicate Results option
Use the Thumbnails view
In the Results pane, select View by Thumbnails to view thumbnails of the images in that result set. If you use the Skin Toned Image filter in conjunction with this view, you can review images based on variations in skin tone. The Thumbnails view indicates items with tags and video files. In this view you are also able:
To view an item in the Preview pane: Click it.
To zoom in and out of the Thumbnail grid adjusting the display size of the Thumbnails: Use the Zoom bar.
To zoom into an individual item, click the item to view and use the zoom option in the Preview pane.
To display all images in the Thumbnails grid as blurred: Select the Blur Images option.
To display a context-sensitive set of commands: Select the item by clicking the check box under the image and right-click the item.
The following table lists the right-click commands for items in the Thumbnails view:
| Command |
Result |
| Copy |
Copies the selected item to the clipboard. |
| Selects all items in the Thumbnails view. |
|
| Select None |
Clears all items in the Thumbnails view. |
| Export |
Exports items using Export controls. |
| Add Tags |
Adds tags to selected items. |
| Remove Tags |
Removes tags from the selected items. |
| Add to Review Job |
Adds the selected items to an existing Fast Review job. |
| Remove from Review Job |
Removes the selected items from an existing Fast Review job. |
| Exclude Items |
Excludes items from being available for further case activity. This suppresses the items in the data set, including items in the associated family and duplicates. |
| Reload Items from Source Data |
Reloads selected items from source data. |
| Assign Custodian |
Adds the selected items to a new or existing custodian with options to include associated family items. |
| Unassign Custodian |
Removes items from the selected custodian with options to include associated family items. |
| Pivot |
Allows you to change the central point of the thumbnail in one of two ways: By time: Set to 30 seconds, 1, 5, 10, or 20 minutes, 1 hour, or 1 day. To pivot further, select All, Item Date, Date Accessed, Date Created, or Date Modified. By location: Set to 100m, 1km, 5Km, 10km, 100km, or a custom distance. |
| Show All Children Metadata |
Finds all child metadata information for the selected items. |
| Show All Descendants |
Finds all child items for the selected items, but not the items themselves. |
| Show All Top-level Items |
Finds the highest-level ancestors for the selected items, but not the items themselves. |
| Show All Families |
Finds the highest-level ancestors and all child items for the selected items, including the items themselves with the results. |
Use the Per-Day Timeline view
In the Results pane, you can view items in your result set in a timeline by selecting View by: Per-Day Timeline.
This view presents the number of items with item date on each day, and the size of the dot is directly proportional to the number of items. That is, bigger dots represent a higher number. You can view the Date, Kind, Custodian, Tags, Languages, and the Count of items created on that date.
You can view the items grouped by:
None
Item Kind
Tags
Custodian
Language
Use the Timeline view
In the Results pane, you can view items in your result set in a timeline by selecting View by: Timeline. This view presents a timeline based on each item. For each item, it displays the Date, Date Field, Name, Kind, Custodian, Languages and Tags.
You can view the items grouped by:
None
Item Kind
Tags
Custodian
Language
Use the Entities view
In the Results pane, by selecting View by: Entities, you can view the named entities related to Company, Credit Card, Email, Money, Personal ID, Country, IP address, and URL in that result set.
Note: Options for named entities only appear if your data set contains named entities.
To process any custom-named entities, ensure that in your Data Processing settings you select the following options:
Extract named entities from text, Include text stripped items
Extract named entities from properties
The Entities view allows you to:
See entities in the data set grouped by those found.
Narrow your results set, by filtering and searching on text that matches, for example, only a particular company or card type.
Only entities that match then appear in the View by > Custom Named Entities pane; however, if there are five entities that are processed but only three entities matched, then only those three entities appear as Custom Named Entities.
Edit custom-named entities and patterns from the Custom Named Entities.
Named entities properties file
The entities mentioned in the chart above are the default entities found in Nuix Workstation and are located in the Named Entities properties file. You can create your own entities and add them to this file. An example of a custom entity is creating and adding a social media entity.
You can create entities on a per-user or PC-wide basis. Store your user-specific ones in C:\Users\<USERNAME>\AppData\Roaming\Nuix\Named Entities, or a similar directory. Usually entities are used PC-wide and stored in C:\ProgramData\Nuix\Named Entities.
Adding a custom entity requires both of the following:
A regexp file: This is a plain text file that holds your regular expression. Name it to represent its content, (for example, social-media.regexp).
Its first line should start with a # (to indicate a comment) followed by a description of what group the entity is part of, such as a location or named entity (the default groups). Its next line should provide the name of the entity.
The last line should provide the path to the icon file and its filename.
For example: C:\Program Files\Nuix\Nuix 9.8\user-data\Named Entities
An icon: This must be a .png file, ideally, 48 x48 pixels in size. Name it to be consistent with the regexp file, (for example, social-media.png).
The following is an example a Social Media entity:
NamedEntities.social.group=Custom
NamedEntities.social.title=Social Media
NamedEntities.social.icon=Social-media.png
Named entity Word Lists
Named entity word lists require a UTF-8 encoded Word List file with an extension of “.list”. To use these, you must copy the required list file to the parent named-entities directory. Any hash characters in the file indicate a comment. If the first line begins with a hash character you can specify an instruction on how the processor should behave.
By default, word matching is case sensitive; however, you can specify it to be caseInsensitive, to match the named entity word lists regardless of case.
For example, by default a Word List with the single word can will match 'canThisBeFound' and with # caseInsensitive on the first line it will match 'CanThisBeFound'. By default, matching occurs anywhere in the file. To match on word breaks you can specify either of the following:
wholeWords to find words separated by a comma or period.
wholeWordsWhiteSpace to find words separated by a space, tab, or new-line.
Then, for example, using:
wholeWords does not match ‘canThisBeFound’ but matches 'can, do' and 'can do'.
wholeWordsWhiteSpace doesnot match ‘can, do’, but matches 'can do'.
Person named entities
Like all Named Entities it uses a regular expression (.regexp) file, but also includes a set of text files to enhance the identification of a person named in the free text. A person's name is identified by an honorific (Duke) or salutation (Hello), followed by a set of camel-cased words, where:
Either the first or last is a distinct given name or surname. For example, "John Notaname" would match, but "Apple Notaname" would not.
BOTH the first AND last matches ambiguous given & surnames. For example, April Anchor.
The names used are mainly constructed from the US census but they also include the common given names and surnames of various other countries. It is used to link people to documents in the context graph.
Use the Files view
In the Results pane, you can view the statistics related to just the items in that result set by selecting View by: Files. This view provides statistics about the number of processed and irregular files by type in the current result set, unlike the
Statistics tab which offers a look at file type statistics for the entire case.
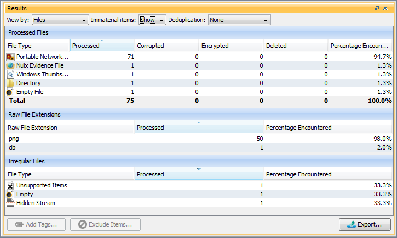
In the Files view, you can:
Click a column header to re-sort the rows, toggling between ascending and descending order.
Double-click a row, to view the items associated with one of the file types in a new Workbench tab's result set.
Click Export to export the view. For more information about exporting views, see Export data from different views in Export data.
Use the Addresses view
In the Results pane, you can view addresses in the result set by selecting View by: Addresses.
Select Group by Domain to view the results, grouped by domain. You can select from the following options: From, To, Cc, Bcc, to view results. By default, the Addresses View uses the previous settings when executing a new search.
Use the Shingles view
In the Results pane, you can view shingles in the result set by selecting View by: Shingles. View hits only for:
ASCII tokens or non-ASCII tokens
Numerical tokens
Atypical Length tokens
All tokens
Then, use the filter to narrow down the returned results in the Shingle List.
Use the Words view
In the Results pane, you can view a list of all words from the items in the current result set, and how often they occur. The Word List includes all words from both the content and properties of the selected items. In the Words view, you can:
Click a column header to re-sort the rows, toggling between ascending and descending order.
View hits for just ASCII words, numbers in the text, non-ASCII words, words that are an Atypical Length, or all terms found.
Create a Word List by searching in the content of the selected documents or from the properties of the selected documents.
Use the filter to narrow down the returned results in the Word List.
Double-click a row to view items in a new Workbench's result set that include a specific word in the list.
Use the Topics view
In the Results pane, you can view a list of all topics from the items in the current result set, and their frequency. This is done after applying a list of stop words followed by stemming and frequency analysis. Nuix Workstation extracts the top five sentences that best represent the text in the selected documents. The top five sentences are selected based on a “frequency analysis” that determines the rank of a sentence. Sentences that contain the most frequently used words are ranked the highest. The view then presents the sentences ordered according to their original flow.
In the Topics view, you can:
Click a column header to re-sort the rows, toggling between ascending and descending order.
View hits for all topic keywords, mostly ASCII topic keywords, mostly non-ASCII topic keywords, some numerical topic keywords, non-ASCII words, or topic keywords that are an Atypical Length.
Double-click a row to open a new Workbench's result set of items that include a specific topic in the list.
Use the Topic Keyword Filter to narrow down the returned results in the topics list.
Set the maximum number of topics to appear in the results list. Nuix Workstation calculates this as a percentage of all items in your case, (default=1%).
Use the Event Map view
In the Results pane, you can view items in a specific thread to learn the persons involved in a conversation or document over time, by selecting View by: Event Map. This view provides a static graphical view of communications in the result set against a timeline, showing who sent the communications and how they were sent to others.
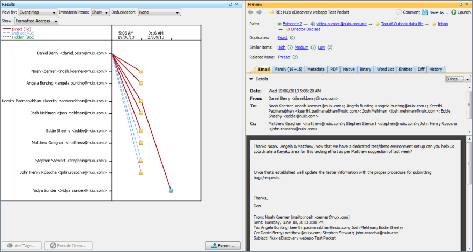
In the Event Map view, you can change how the address labels in the right-hand column of the Event Map appear by selecting the following options from the Address menu:
None: To suppress the display of the email address.
Personal: To display only the personal portion of each email address. For example, John Smith would only display as "John Smith".
Address: To display only the address portion of each email address. For example, John Smith would only display as "john.smith@nuix.com".
Personal or Address: To display either the Personal or Address portion of the email address, depending on its availability.
Formatted Address: To display the fully formatted email address. For example, John Smith would display "John Smith".
You can also export the Event Map view.
Note: All dates and time are stored as system time, which is essentially the number of ticks since 1970. When the items then appear, Nuix Workstation applies the appropriate time zone defined in the Case Properties dialog.
Use the Network view
In the Results pane, you can analyze patterns of communication between persons in a set of evidence by selecting View by: Network. The Network view provides a dynamic view of these communication patterns, including the frequency of communication and any outlying communications in a graphical format.
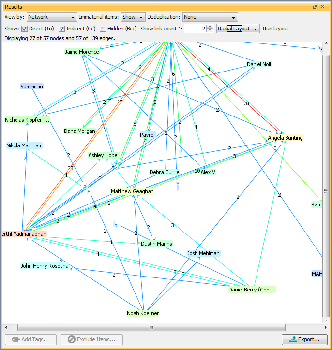
You can filter the items that appear in the Network diagram by selecting the following options:
Direct (To): To show or hide items listed in the communications To field.
Indirect (Cc): To show or hide items listed in the communications Cc field.
Hidden (Bcc): To show or hide items listed in the communications Bcc field.
Show link count: To set the minimum number of communications that must have occurred for items to show in the diagram.
If the diagram is dense and you want to view fewer items based on the frequency of communications, then increase the value in this field.
The Network diagram is a dynamic view of the communications information associated with the specific result set. This means that the display changes as you filter or change the result set. Use the following options to customize the view:
Run Layout: To freeze or unfreeze the automatic placement of the nodes in the diagram; that is:
Select this option to make the diagram active and display the nodes in the most readable layout for viewing (whereby the nodes continue to pulse as the application continually optimizes the view). Or clear this option to lock the diagram in place while able to manually move the nodes.
Scroll and Pan: To hold down the left mouse button on the background (white) area of the view to scroll the diagram up, down, left, or right, without changing the rotation or proximity of the nodes.
Zoom: To hold down the right mouse button on the background and move the cursor up or down on the Y-axis of the screen to zoom in or out on the diagram.
Rotate: To hold down the right mouse button on the background and move the cursor left or right along the X-axis of the screen to rotate the diagram clockwise or counterclockwise.
Highlight all Communications Partners: To move the mouse over an address or left click on it to highlight all of the partners in the view who have communicated with that specific address.
Highlight Two Communications Partners: To move the mouse over a line or left click on a line between two addresses to highlight the addresses associated with that communication.
View Items Sent between Two Addresses: To double-click a communications line to display those items in a new result set view.
You can also export the Network view.
Use the Map view
When you have large amounts of digital evidence involved in a case, you need a fast method of prioritizing the evidence that matters to your investigation. Using the Map view, you can quickly narrow down the scope of critical information using key location or time data.
In the Results pane, select View by: Maps to pin longitude and latitude float values from within a Nuix property field and plot the coordinates on a map view. The Map view allows you to perform a search around a given point. It is not a requirement to be connected to the internet to have the map view working as Nuix Workstation also supports offline maps to access evidence from online sources without leaving your investigative environment.
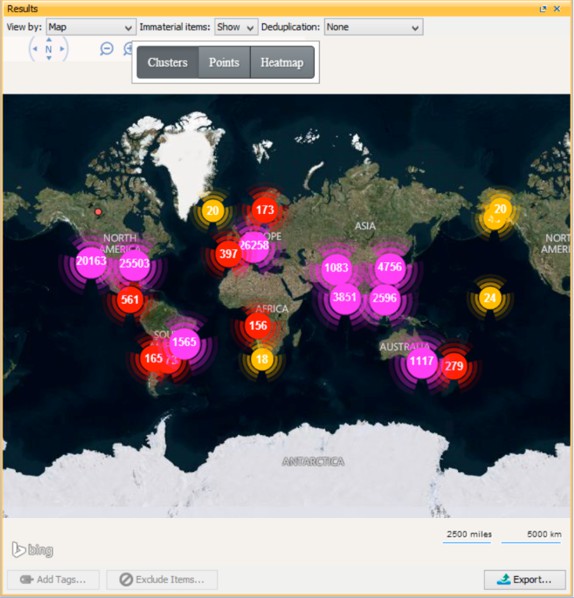
In the Map view you can:
Use the Points setting to represent each individual item on the map.
Use the Heatmap setting to show areas of high activity, useful with a large quantity of items.
Use the Points setting to represent each individual item on the map.
Select a file with GPS coordinates and pivot to find items with GPS coordinates in a specific radius.
Show where camera images were taken by plotting the co-ordinates from:
Exchangeable Image File (.EXIF) information, or
Resolving IP addresses found in log files to a geographical location and using the Heatmap function to display locations of high-volume traffic.
Select the Pivot by Location and Time option to find all items with a timestamp within these time periods: 30 seconds; 1, 5, 10, or 20 minutes; 1 hour, or 1 day.
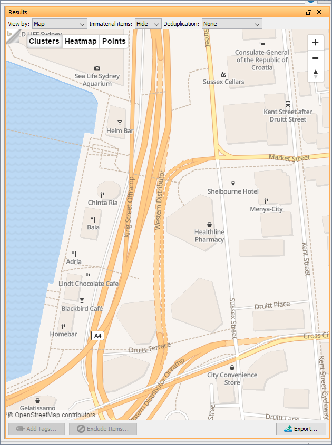
Toggle between online maps and offline maps, by clicking in the top left corner.
Work with offline maps
Nuix Workstation supports the mbtiles maps format.
You require a maptiles server to work with offline maps. The following instruction uses the Klokantech OpenMapTiles Server running on Docker Desktop for Windows but its steps are almost identical on other platforms. To work offline with the mbtiles maps format:
Download and install Docker Desktop from https://docs.docker.com/get-docker/.
Open a command line to make and change the directory for the server configuration, per this example:
mkdir \Data\openmaptiles-server cd \Data\openmaptiles-server
To start the server to automatically download resources and perform other installation tasks when first run, enter:
docker run --rm -it -v %cd%:/data -p 8080:80 klokantech/openmaptiles-server
When command line initialization is complete you are prompted to complete the installation using a browser.
Then navigate to: http://localhost:8080
Follow the installation wizard to install and configure the default maps and styles.
The default map only gives fine detail for Zurich, Switzerland, but you can upload more map sets.
Once fully configured the OpenMapTiles Map Server page presents you with a selection of map styles to view.
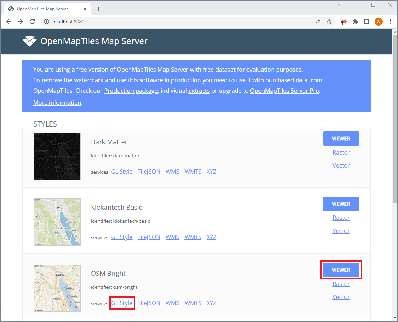
Click Viewer to verify the installation.
Copy the address of the GL Style link to use in Nuix Workstation.
In Nuix Workstation, navigate to Global Options, select Results, then Map View.
In the Offline maps tile server URL field, enter the json address of your style choice. For OSM Bright this should be http://localhost:8080/styles/osm-bright/style.json
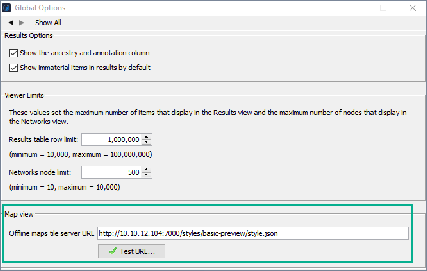
Click Test URL to verify that Nuix Workstation can connect to it.
To apply this setting, you must close your Workbench tab, and then re-open it.
Note: If the "style.json" URL for the map-tiles is on a different server to the actual tile-server then you need to start Nuix Workstation with the -Dnuix.web.disableSecurity=true switch.
Use the Charts view
The Charts View provides a summarization and reporting view in a pivot table format, allowing you to quickly adjust the summary by dragging and dropping fields. It is particularly suited to structured data sets, such as spreadsheets, databases, and logs. Using a pivot table allows you to automatically sort, count, total or average the data and visualize it as a table or chart.
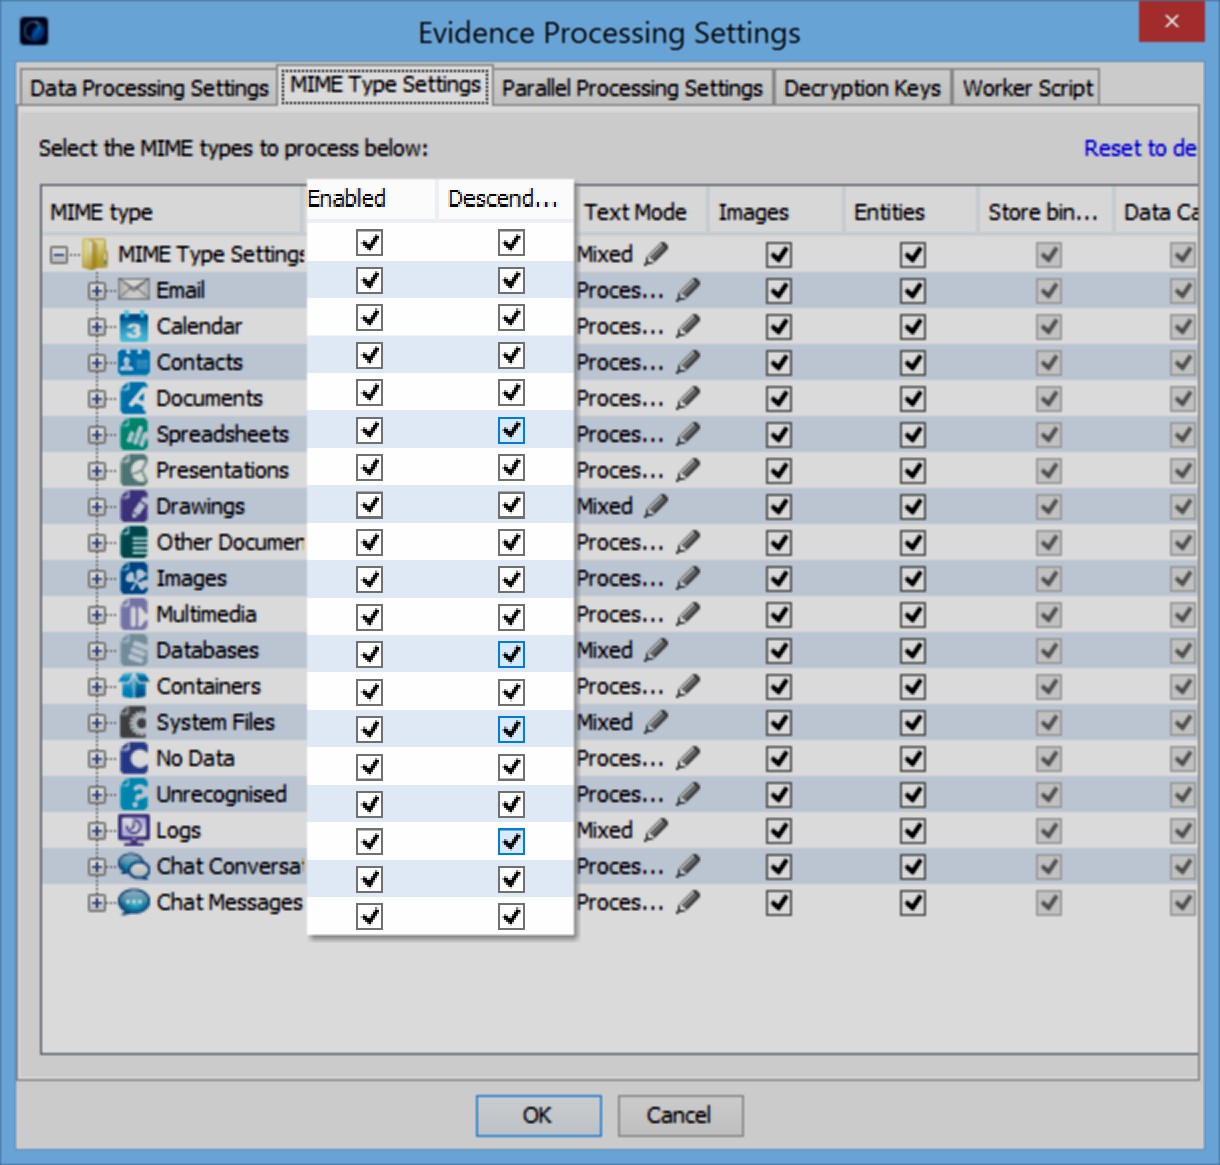
To report fully in the Charts view, ensure that, in the MIME Type Settings tab of the Evidence Processing Settings window, you select all Enabled and Descendants check boxes for all MIME types.
Note: When you ingest data, the Results View, by default, will not show data from structured files, such as spreadsheets, databases, and logs. However, if you select one of the items in the dataset, you can view data for a structured file as Properties in the Metadata tab of the Preview pane. To see those fields, in either the Results or Charts View, you need to create a Custom Metadata Profile. To configure a profile, right-click in the Results View, select Choose Column Profile then Edit Metadata Profiles, and select the profile with the fields.
Once you have an appropriate profile, use the fields as columns in the Results View by right clicking a column heading and selecting the profile from the Choose Column Profile submenu. The Charts View also provides a menu for selecting or editing Metadata Profiles.
You are now able to use Charts View. The first time that you use the Charts View feature, Nuix Workstation shows you a tour of the major components of its interface.
Charts view controls
The Charts View has the following controls for use in analyzing your data:
| Control |
Action |
| Fields |
As the attributes available for your data, drag selected ones into the Columns or Rows area for use in analyzing your data. You can also select a Metadata Profile here or create a new one using the editor. Note: 'Multi-value' metadata field types are not available in the Charts View. |
| Rows |
When using a Table Visualization, this determines the rows of the table. In most Chart visualizations, this provides the vertical axis, and as a result, only one available value. |
| Columns |
Fields in this row are used to determine the columns of a table in a Table Visualization. In most Chart visualizations, this field provides the horizontal axis. |
| Values |
Select one of the following methods for how the value of the cells in the table or points on a chart is calculated: Count, Sum, Average, Minimum, and Maximum. This can be a simple count of the items that match the grouping options, or an aggregation applied to specific properties. When choosing an aggregator, you must also choose the property to be aggregated in the popup that opens. |
| Visualization |
Select a table or chart format to represent your data visually. See the following table for more details. |
Charts view visualizations
The following visualizations are available:
| Visualization |
Description |
| Table |
The rows, columns, and values, all correspond to what is selected in the field. |
| Table Heatmap |
The rows, columns, and values, all correspond to what is selected in the field. The color of each cell corresponds to the setting you select in Values. |
| Bar Chart |
Values provide the vertical axis, and Column the horizontal axis. The first Rows' field corresponds to the color-series. |
| Stacked Bar Chart |
Values provide the vertical axis, and Column the horizontal axis. The first Rows field' corresponds to the color-series. |
| Line Chart |
Values provide the vertical axis auto-scaled to data points, but which does not include zero. The column provides the horizontal axis. The first Rows' field corresponds to the color-series. |
| Area Chart |
Values provide the vertical axis, and Column the horizontal axis. The first Rows' field corresponds to the color-series. |
| Pie Chart |
Values correspond to the area of each slice of the pie. Columns correspond to the color of each slice of the pie. |
| Bubble Chart |
The vertical axis is the first value in the Rows field, and Column the horizontal axis. The size of each bubble corresponds to Values. The second Rows' field corresponds to the color-series. |
| Scatter Chart |
This visualization is similar to the Bubble Chart, but the color of the individual point reflects its value to create a heatmap effect. The vertical axis is the first value in the Rows' field, and Column is the horizontal axis. The color of the individual points corresponds to Values. |
Click an individual cell in a table, or a point or segment of a chart to view the matching items in the Workbench or Context tabs. You can export any of the charts and tables to a separate file or to Case Notes.
Charts view icons
The following table details icons in each chart, and how to use them to examine your data in more detail:
| Icons |
Action |
| Zoom |
Click a corner of the chart and drag it to another area to create a zoom box. Enabled by default, this setting allows you to zoom in on a specific area of the chart. Using it disables Pan mode. |
| Pan |
Click to move either to the left or the right in the chart, and move its content up and down. |
| Zoom In |
Click to increase the amount of zoom. |
| Zoom Out |
Click to decrease the amount of zoom. |
| Reset Axes |
Click to return the axes back to their original positions. |