View search results
After constructing a search query and performing a search, the results that return from the query can be viewed in several views that are provided within Nuix Investigate. The views include:
A Dashboard View that provides a visual representation of the data
A Grid View with sortable columns (up to 10,000 items)
A Review View for reviewing items one at a time
A Gallery View to see items displayed as thumbnails
The Grid View appears by default, but you can access other views by selecting their respective tabs located above the results. Query results and item selection persists across all views, allowing investigators to choose the view that works best for what they are trying to accomplish. Views can also be toggled using hotkeys.
Tip: Double-clicking the tab of any view makes that view the default view, indicated by the notch on the tab.
Nuix Investigate tracks and visually distinguishes the items in a case that have been previously viewed. Viewed items are stored within the application and are maintained individually for each user, making it easier to track the remaining items that need to be reviewed. Items that have not been viewed display within the Grid and Gallery Views with a bolded text. When an item is selected for a period of at least two seconds, the item is considered viewed and no longer displays in a bolded font. The Reviewed Items count at the top of the application increments to show the total number of items within the case that have been viewed by the current user.
Note: The Viewed Items Count feature can be switched on or off from the Nuix Investigate window of the Nuix Configuration Utility. See the Nuix Investigate Configuration Guide for more information.
Dashboard view
The dashboard shows a visual representation of the content within an evidence set. This representation is called a perspective and is made up of one or more analytics. Analytics take the results from a query and visualize the content using charts, graphs, and tables. When viewed in this manner, you can see a high-level overview of the case data. This can be helpful in determining the direction that an investigation takes.
The provided analytics help organize case data to show Relationships, Time, Statistics, and Location. Combining different analytics within a perspective to view data visually often provides the benefit of seeing patterns and anomalies that may have been difficult to discover if looking only at the data. Analytics can quickly show what content makes up the case, relationships that exist between items, timeframes of when events occurred, and location data to help locate where a file or conversation originated.
The dashboard works in concert with the current search criteria and metadata profile. When any of the search parameters are changed, the analytics dynamically update to show a representation of the updated result set. Analytics are also fully interactive and provide the ability to drill further into search results by clicking within the analytic.
See Appendix C: Dashboard Analytics for additional information on the analytics that are available.
Use the dashboard
The Dashboard View is a tool that can be used to help make sense of the data contained within a case. The available analytics assist in this goal by providing assorted, targeted queries that help sort and organize the case data into useful, understandable chunks. Once data has been broken out within the analytics and a high-level view of the information becomes visible, the Dashboard View allows users to:
See the makeup and identify the kinds of data that are included in the case.
Identify patterns, trends, and anomalies.
Further narrow results, locate relevant information, and drill down into specifics.
Determine the workload, resources, or skill sets needed to process the case.
Regardless of the current direction of a case, starting from the dashboard can help save time. Investigators and reviewers who know what they are looking for can use dashboard analytics to quickly find and locate the information that is relevant to them. For investigations that are not initially clearly defined, the visual aspect of the dashboard can help investigators reach that “I’ll know it when I see it” moment sooner than if just looking at the data directly.
Most importantly, these results can be achieved without needing to first generate an extensive complex search query. Using the dashboard to narrow results generates the refined queries for you. Users can then switch to one of the other provided views to begin analyzing and processing the data.
Navigate the Dashboard view
The Dashboard View menu bar provides options for selecting, configuring, and saving perspectives. The menu bar includes the following:
Add Analytic to Perspective: Select this option to view all available analytics that can be added to the current perspective. Analytics are organized by the following categories: Relationships, Time, Statistics, and Maps.
View Open Analytics: Select this option to bring any analytics currently open in external windows to the front of your workspace.
Perspective list: This menu lists all Nuix and user-created perspectives that can be applied to the case data. Nuix Investigate provides the following perspective by default:
Neo Summary - (Default Perspective)
Note: The perspectives provided with Nuix Investigate cannot be renamed or deleted.
Create a New Perspective: Select this option to create a new custom perspective.
Save Perspective: Select this icon to save changes to the current perspective.
Perspective Management:  Expand this menu to manage the perspectives or create a Dashboard report.
Rename Perspective: Click to rename the currently selected perspective. Available only for user-created perspectives.
Set as Default Perspective: Click to have the currently selected perspective set as the default perspective for the current case.
Reset Perspective Settings: Select this option to restore the current perspective to its default settings. All saved changes previously made to the perspective are lost. This option is only available for Nuix provided perspectives.
Dashboard Report: Select this option to generate a report that captures a summary of the content currently displayed within the Dashboard including maps. The report options include:
| Contains: Options |
Description |
| Summary data and visualization image |
This option includes both the summary data information as well as the visualization within the report. |
| Summary data |
This option includes a table that lists the types of content found within the case and details for each type. |
| Visualization image PNG |
This option includes a copy of the Case Summary visualization, as depicted within the analytic. |
| Include: Options |
Description |
| Detailed data tables |
Select this option to include a second table within the report that contains all queries used to generate results for the analytic. |
| Visualization image PNG |
Generate the Case Summary visualization as a separate downloadable PNG file. |
| XLSX |
Generate the report as an XLSX spreadsheet in addition to a PDF. |
Delete Perspective: Click to delete the currently selected perspective. Available only for user-created perspectives.
The perspectives provided by Nuix are intended as examples or starting points for your investigations. No two cases are the same and no one perspective fully encompasses the breadth of a single case. The following perspectives display the capabilities of the Dashboard View and how it can be customized to benefit your investigations. The following table provides descriptions for each of the provided perspectives. The remaining portion of this section explains how you can further customize your Dashboard View to meet the needs of your investigation.
| Perspective Name |
Description |
| Neo Summary (Default) |
Provides a broad view of the case content including any relationships and commonalities that exist between items, including the origin location of items. |
Customize the Dashboard view
The perspectives that come with Nuix Investigate display several analytics curated specifically for that perspective. Perspectives, however, are completely customizable. Within a perspective, you can move, resize, or remove analytics from view. You can also add new analytics to a perspective from the menu bar.
Tip: View data in different view or format by adding multiple instances of the same analytic to a perspective, then customize each to display the content you want.
Once you achieve your required layout, preserve your changes by clicking the Save Perspective icon from the Dashboard menu bar.
Within the perspective, each analytic includes a menu bar with the following options:
Lock Analytic: Select this option to prevent an analytic from changing or refreshing when the active query is changed.
Analytic Management: Expand this menu to view the following options for the analytic.
Refresh: Select this option to refresh the results displayed within the analytic.
Configure: Select this option to view configuration options for the analytic.
Configure Report: Select this option to configure report settings for an analytic and generate a report.
Open in New Window: Select this option to open an analytic in a separate window. When selected, the analytic within the dashboard becomes disabled until the external window is closed.
Create custom analytics
The analytics provided with Nuix Investigate come preconfigured with default settings. These configurations, however, can be modified to best suit the needs of the investigator. Each analytic offers some form of configuration, whether it is specifying the item details to include in the analytic or choosing how the content is displayed.
If the provided analytics do not meet the needs of the case, Nuix Investigate also includes the ability to modify a few of the existing analytics beyond the basic configuration settings. The following two dashboard analytics can be modified to include user-defined configurations.
This section explains how to access the analytics and provides instructions on modifying and testing user-generated content.
Locate analytics for customization
The Breakout and Case Summary analytics are provided as editable JSON files that can be modified by the user. The JSON files as well as corresponding collateral are in the following directories within the Nuix Investigate installation.
The installation paths provided are based on default Nuix installation settings. Actual paths may vary based on your installation.
Warning: The filenames and locations of items in the following table must remain unchanged.
Warning: The provided default Breakout and Case Summary analytics have been localized into all supported languages. Deleting or modifying these analytics in any way causes all translations to be lost.
| Dashboard Item |
Location |
| Analytic JSON files |
<InstallDir>\Nuix\Nuix-Investigate\visualizationConfig |
| Analytic icons |
<InstallDir>\Nuix\Nuix-Investigate\visualizationConfig\breakout-icons |
Tip: The Analytic JSON Files location can be changed by configuring the Visualization Configuration Location property for the Nuix Investigate component in the Nuix Configuration Utility. See the Nuix Investigate Configuration Guide for more information.
Modify the breakout.json analytic
The breakout analytic displays details for items that are broken out by a specific category, item kind, or group. Within the JSON, three predefined profiles are included that represent collections of items that have proven to be beneficial when viewed together.
Investigation
Mobile Devices
Information Governance
Note: To see dashboard profiles, you must have the User folders location property set to the correct location in the Nuix Configuration Utility. See your administrator for more information.
This analytic can be customized to change the items included within these profiles, or to create new collections of items altogether.
When modifying the analytic, the existing profiles that are provided can be customized directly. However, creating a new profile within the analytic is recommended. Once a new profile is defined within the JSON, you can either copy the contents from an existing profile to use as a template, or create your breakout analytic from scratch.
To get started:
Open the analytic within an editor of your choice. The structure of the breakout.json file is defined:
{
“name”:“Profile Name”,
“breakoutQueries”:[
{
“name”:“Query Name”,
“icon”:“Filename_of_icon_to_display”,
“query”:“Query used to return results”,
“metadataProfile”:“Metadata profile to apply to results”
"view": <View>
},
{
}
Where <View> can be any of: Dashboard, Grid, Gallery, or Review
Define a new profile within the JSON following the existing content as a guide.
Provide a new profile name, which is used to identify the new profile when viewing it in the Dashboard UI.
Specify the filename of an icon to display next to the query results in the analytic.
Note: Existing icons can be reused, or new icons can be added. All custom icons must be in the breakout-icons directory specified previously and be 48 x 48 pixels in size. Supported image types include: PNG, JPG, GIF, and SVG.
Next, define one or more queries, formatted using Nuix Search Syntax, which returns information that is important to your case.
Optionally, specify a metadata profile to apply to the results when a query is selected in the analytic. If no profile is defined, the current active metadata profile is used.
Optionally, specify the view in which the results are to be displayed. If no view is chosen, the results display in the Grid view.
When finished, save your changes within the visualizationConfig directory.
Note: Customized json files are not merged into the application when upgrading to a new version. The Nuix Investigate installer, however, creates a backup of any customized analytics that are located on the system prior to performing the upgrade.
To retrieve the backed up custom analytics, navigate to the default visualizationConfig directory after the upgrade process completes. The backed-up files are located within the directory with the following file names:
- caseSummary.last.json
- breakout.last.json
The backed-up customizations must then be manually merged back into the default analytic JSON files as described in the previous steps.
All updates that are made to the Breakout analytic are available immediately within the application.
All items returned by your query can be further filtered by the following analytic customization criteria in the Dashboard:
Custodian
Custom Metadata
Evidence Container
Modify the caseSummary.json analytic
The Case Summary analytic displays a chart representation of the result set based on a set profile. Within the JSON, four predefined profiles are included that represent collections of items that have proven to be beneficial when viewed together.
High Skin Tone Images
eDiscovery
Investigation
Information Governance
This analytic can be customized to change the items that are included within these profiles, or to create new collections of items altogether.
When modifying the analytic, the existing profiles that are provided can be customized directly, however, creating a new profile within the analytic is recommended. Once a new profile is defined within the JSON, you can either copy in the contents from another profile to use as a template or create your Case Summary analytic from scratch.
To get started:
Open the analytic within an editor of your choice. The structure of the caseSummary.json file is defined:
{
“name”:“Profile Name”,
“caseSummaryQueries”:[
{
“name”:“Query Name”,
“query”:“Query used to return results”,
“metadataProfile”:“Metadata profile to apply to results”
"view": "View to show results"
},
{
}
Define a new profile within the JSON following the existing content as a guide.
Provide a new profile name to be used to identify the profile when viewing it in the Dashboard UI.
Next, define one or more queries, formatted using Nuix Search Syntax, which returns information that is important to your case.
Optionally, specify a metadata profile to apply to the results when a query is selected in the analytic. If no profile is defined, the current active metadata profile is used.
Optionally, specify the view in which the results are to be displayed. If no view is chosen, the results display in the Grid view.
When finished, save your changes within the visualizationConfig directory.
Note: Customized json files are not merged into the application when upgrading to a new version. The Nuix Investigate installer, however, creates a backup of any customized analytics that are located on the system prior to performing the upgrade.
To retrieve the backed up custom analytics, navigate to the default visualizationConfig directory after the upgrade process completes. The backed-up files are located within the directory with the following file names:
- caseSummary.last.json
- breakout.last.json
The backed-up customizations must then be manually merged back into the default analytic JSON files as described in the previous steps.
All updates that are made to the Case Summary analytic are available within the application immediately.
The results returned from your queries can be shown using any of the following display types within the Dashboard:
Audit Size
Count
File Size
Create a custom dashboard perspective
If the provided dashboard perspectives do not meet the needs of your investigation, the Dashboard View provides tools that enable you to create your own. Creating a custom perspective allows you to carefully select and configure the analytics that are of most use to your investigation.
To create a custom perspective:
From the Dashboard View, click the Perspective Management  icon.
icon.
Select Manage Perspectives from the menu.
Enter a name for the new perspective at the top of the User Perspective Management window.
Click Create Perspective.
The Dashboard View refreshes to display your new blank perspective. Click the Add Analytics to Perspective  icon to populate the perspective with analytics best suited for your investigation. When you have finished adding and configuring your analytics, click the Save Perspective icon to save your changes.
User-generated perspectives are created as JSON files with a unique GUID filename and .perspective file extension.
View customized analytics in the dashboard
After customizing the Breakout or Case Summary analytic, place the updated JSON files and any associated icons, if applicable, into the directories specified in Locating Analytics for Customization.
To access the new analytics after the files are in place:
Open Nuix Investigate in a browser or refresh the browser tab if already open.
Select a case and perform a search.
From the Dashboard View, add the analytic to the perspective if it is not already included.
Click the Analytic Management  icon and select Configure from the menu.
Choose the Profile that contains your customizations.
Click Update.
The analytic refreshes within the dashboard to display the selected profile and any customizations. If the analytic does not display properly, check the .JSON file for the analytic to ensure it is well formed and does not contain errors.
Grid view
The Grid View uses a table layout to display all items that are responsive to a search query. Each row represents an item in the result set while the columns show associated item metadata. The metadata displayed within the columns is configurable based on the selected metadata profile. By default, the Grid View displays 50 items per page but can be configured to show up to 250 items. Directional arrows located below the grid indicate the current page and total number of pages, allowing users to navigate between pages.
This view provides the most efficient layout for viewing case item details. To make the table easier to read, columns within the grid are initially sized to fit the information that they contain. To support this expanded view of the data, the grid also allows for both vertical and horizontal scrolling. This default layout allows more data to be displayed within each page of results, making reviews and culling activities easier to perform.
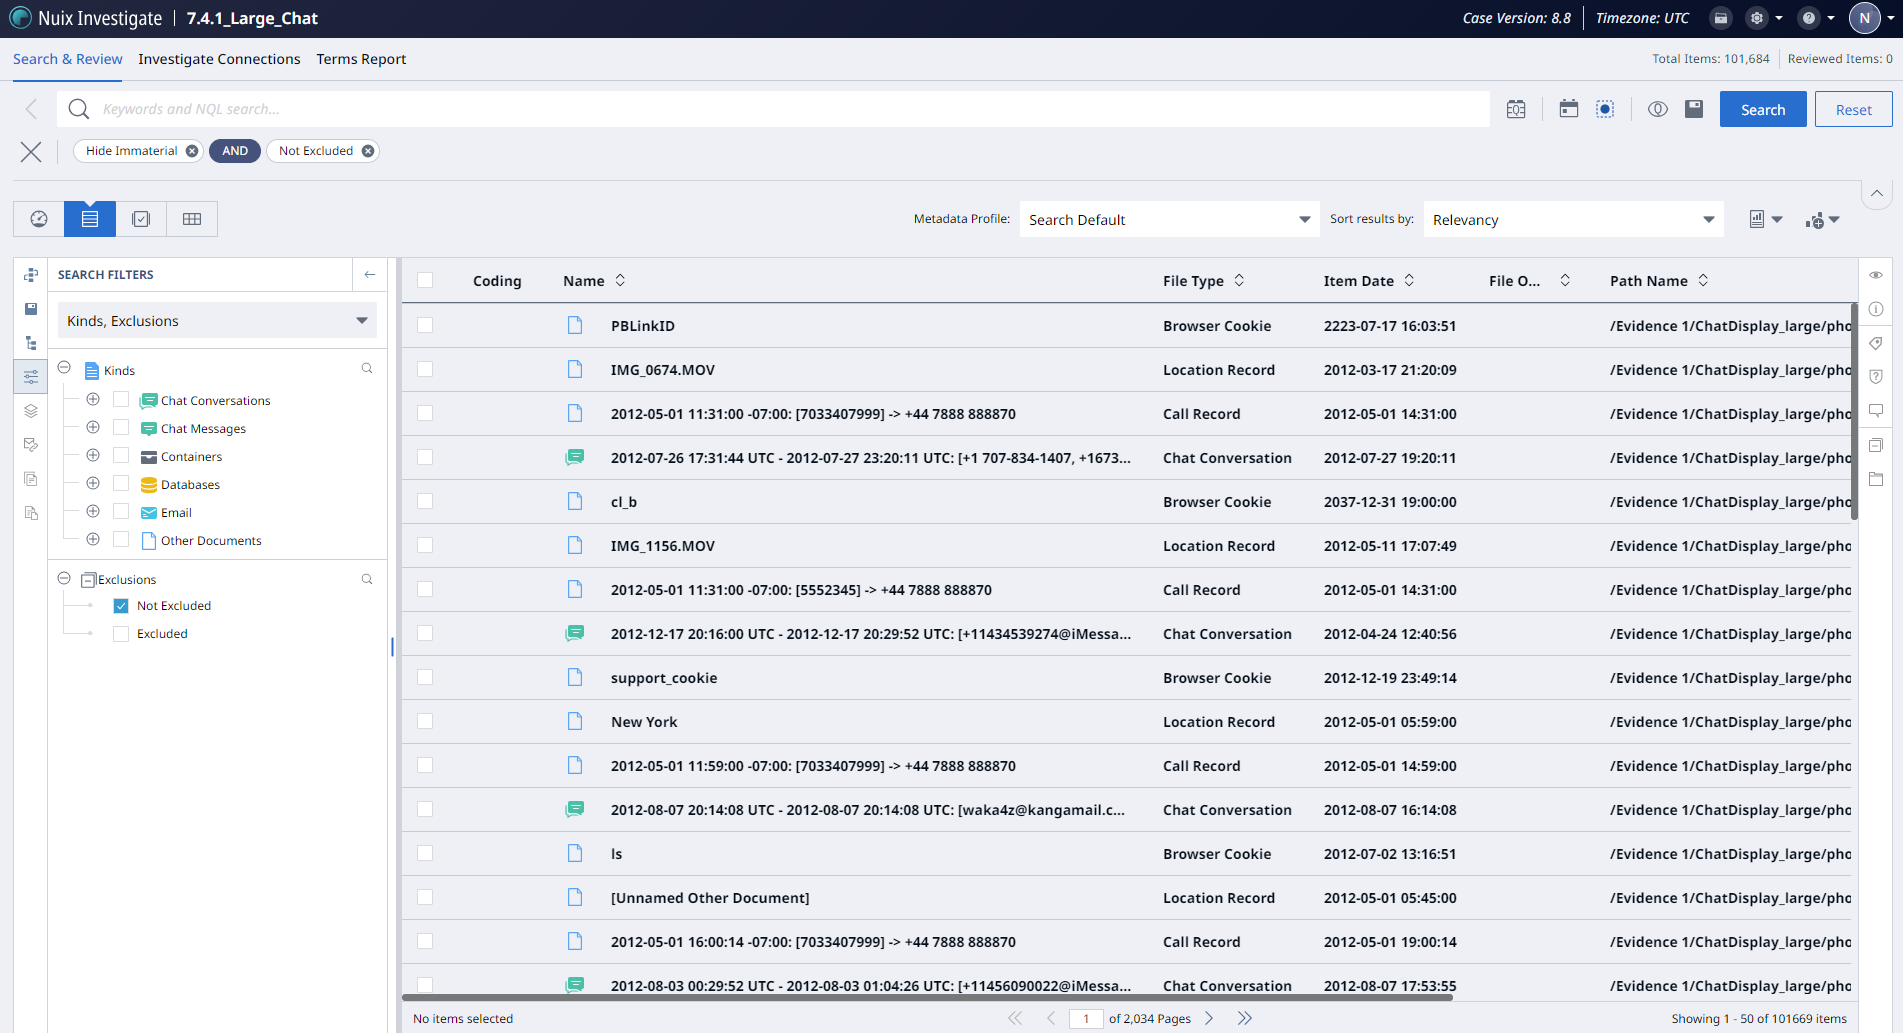
Within the Grid View, icons are used to indicate specific item details. Visible within the Coding column, the following icons display when an item has any of the following user-generated metadata:
Tags: 
Comments: 
Hovering over either icon displays a preview of the associated metadata. To view further details, click on the icon to open the tagging or commenting panels.
Within the Name column, icons are also used to identify the item’s kind and if it contains an attachment.
 |
Attachment |
|
Container |
|
Image |
|
Presentation |
|
|
Calendar |
|
Database |
|
Logs |
|
Spreadsheet |
|
|
Chat Conversation |
|
Document |
|
Multimedia |
|
System |
|
|
Chat Message |
|
Drawing |
|
No Data |
|
Unrecognized |
|
|
Contact |
|
|
|
Other Documents |
|
|


When an item is selected within the Grid View, the Default Preview pane opens from the Item Details drawer to display a preview of the selected item. The Item Details drawer also provides access to view any metadata associated within the item, including user-generated metadata such as tags, comments, and secured fields.
Multiple items can be selected within the Grid View by selecting the check box next to each item in the table. The total number of selected items, across all pages, is displayed in the bottom left corner of the view. To select all items within the result set, click the Select All check box located within the table header. Clear the Select All check box to deselect all items within the result set.
Customize the Grid view
Access the Grid View customization menu to configure different aspects of how items are displayed within the view.
To access the Grid view customization menu:
Ensure the Grid View is open.
Right-click on any column heading within the view to display the customization menu.
Under Number of items per page, expand the menu and choose a value from the available options. (50, 100, 150, 200, 250, 500, 1000 items.) When a value is chosen, the Grid View refreshes to reflect the new selection.
Click Show / Hide row numbers to toggle the display of row numbers within the Grid View.
All changes made persist across cases and sessions until the value is either changed or the browser cache is cleared.
To customize your view of the data further, the default layout provided by the metadata profile can be modified by:
Resizing columns to expand or reduce a columns width:
Double-click between column boundaries to auto-size the column to fit the data.
Click and drag  the column boundary divider to set a specific width.
Reordering columns to change the placement of data within the grid:
Click and drag  a column heading to move it to a different position.
Sorting items in:
Default Order  (User definable as Item Date, Position, or Relevancy)
Ascending Order 
Descending Order 
Note: If the result set exceeds 10,000 items, the ability to sort in ascending or descending order is switched off by default. Narrowing the result set to less than 10,000 items enables the ability to sort.
The Item Date, File Size, and Position metadata columns are not affected by these restrictions. These columns have been optimized for performance and can be sorted at any time regardless of the size of the result set.
If required, the 10,000 item maximum sorting restriction for non-optimized columns can be switched off by an administrator within the Nuix Configuration Utility by enabling the Unrestricted sorting enabled property. However, special consideration should be taken prior to enabling this setting because sorting columns within large result sets can significantly reduce performance. See the Nuix Investigate Configuration Guide for more information.
You can choose the displayed metadata by expanding the Metadata Profile list located in the Result Set Options bar and choosing a metadata profile to be applied to the result set. You can also type in a keyword to locate a specific metadata profile. For information on creating metadata profiles, see Building Metadata Profiles within the Nuix Workstation User Guide.
You can change the sorting method used when Default Order is selected by using the Sort Selector located in the Result Set Options bar.
Available sorting methods include:
Item Date (Ascending/Descending): Sort results by item date.
Position: Sort results based on an item’s position within the evidence set. Position sorting preserves the original parent/child ordering of items that is captured during ingestion.
Relevancy (Default): Sort results based on how relevant an item is to the current effective query.
The Default Order sorting method that is chosen persists for that user within the selected case. If they change their selection, the result set refreshes to reflect the new sort order.
Note: When the Default Order is changed, the result set returns to the first page of results.
To change the direction of sort within a column, click the Sorting icons  located within each column header to cycle through each of the available options. Only one column can be sorted at a time.
Any customizations that you make to the view persist across sessions and browsers to preserve your experience. Metadata Profile customizations, however, do not persist across cases, or user accounts. Grid customizations are preserved within a profile that is associated specifically with the user, the case, and the selected metadata profile. If the metadata profile is applied within a separate case, or by a different user, the customizations that you made are not visible. Instead, the default metadata layout is displayed.
Note: Each metadata profile has a default metadata layout that defines the order in which columns are displayed within the Grid View. This layout is displayed to all users who have not made any customizations to the metadata profile within the Grid View.
If an administrator or a user who belongs to a group with the Manage Default Metadata Profile Search Settings privilege within UMS makes any customizations to a select metadata profile, those changes overwrite the default metadata layout that is presented to non-privileged users.
If, however, a non-privileged user has already made customizations to a select metadata profile, their customizations persist within their user profile and are not overwritten by any changes made by an administrator or privileged user.
If the source .XML file for a metadata profile is modified on the file system to add, remove, or rename a column, those changes are propagated to all users who have the template applied within a case. If a user has previously customized their layout of the metadata profile, all changes are appended to the right of the users customized layout to minimize any disruption to the user.
Note: If you upgrade to a later version of Nuix Investigate and you had made changes to a Metadata Profile that is shipped with the product, your customizations are lost. Nuix recommends that you backup any customizations before performing the upgrade, then applying the customizations again.
Identify related items
To search for related items within the Grid View, select one or more items and then right-click within the view to open the context menu and choose from one of the following search methods.
Pivot: Perform a pivot search based on the time or location data within selected items.
Show All Options: Cull the current result set to only show one of the following item types:
Top-level Items
Descendants
Families
Show in Directory Browser: View the parent container of the selected item in the Directory Browser.
Investigate Connections: View the currently selected items within the Investigate Connections view.
Create CSV reports
In some instances, it may be necessary to export the results of a query to a Comma Separated Value (CSV) file for further analysis. Within the Grid View, this option is available from the Result Set Options bar if you have the Reports - Grid CSV Export privilege.
To export the results of a search query to a CSV file:
Perform a search within the case.
From the Grid View, click the Create Report icon and then select Create CSV report from the menu.
Note: The ability to export query results to CSV is only available to administrators or users who belong to a group with the Export Data as a CSV privilege in UMS.
The CSV file saves to the browser’s default downloads location using the following file name format:
Case Name_YYYY-MM-DD HHMMSS.csv
The data and columns included in the CSV file depend upon the metadata profile currently applied to the result set prior to export.
Depending on the size of the result set and metadata fields chosen for export, the generation of the CSV could be a time intensive process. A progress animation appears along with the option to cancel the export during this process.
Export grid reports
Available from the Grid View if you have the Reports - Grid Report privilege, you can generate reports that include details about specific items from the current result set. Each Grid Report is generated as a downloadable PDF by default but can also be exported as an XLSX spreadsheet. Native and PDF versions of each item included in the report can also be exported to a zip archive if required.
To generate a Grid report:
Perform a search within a case.
From the Grid View, click the Create Report icon and then select Export grid report from the menu.
Provide a Report Name. The name must begin with an alphanumeric character.
Optionally, choose one or more Group by options to specify how the items are grouped within the report:
None: If an option is not selected, items will be organized using the Sort by option.
Evidence container: Group by evidence set. (Default)
Tag: Group by tags.
Kind: Group by item kind.
Custodian: Group by custodian.
Choose a Sort by option to specify how items are sorted in the report.
Choose a profile from the Metadata profile list to specify which metadata fields are included.
Under Include item files, select to export additional items with the report. Options include:
Note: Selecting an include option restricts the report to 1.0 GB in size or 1000 items.
Native – Download the natives/binaries in a zip archive for all items included in the report.
If a special character is included within an item’s name, that character is replaced with an underscore ( _ ) when downloaded.
Special characters include: < > : ” / \ | ? *
PDFs – Export and download PDFs for all items in the report.
Note: The Native and PDFs options are only visible if the user belongs to a group within UMS that has been assigned the Enable PDF/Image View or Download privileges.
Under Report options, select from the following options:
Embed Thumbnails: To include thumbnails within the report.
Note: Thumbnails can only be included if they have been generated within the case.
XLSX – Export the report as an XLSX spreadsheet in addition to PDF.
Click Export to create the report.
After generation, the report files appear within the Grid Report Options window under the Downloads section as links. Click any of the links to download that item. If any of the report files are unable to be generated, an error file is generated in its place.
Note: Items restricted with Item Security can only be included in a Grid report if the user generating the report has the appropriate privileges to view those items.
Note: An administrator can edit the results of the exported Grid Report by editing the following properties in the Nuix Configuration Utility: See the Nuix Investigate Configuration Guide for more information.
- Grid Report item max - Sets the maximum number of items that can be included within a Grid Report. A value of 0 sets no limit.
- Grid Report item export max - Sets the maximum number of items that can be exported with a Grid Report. A value of 0 sets no limit.
- Grid Report export size max - Sets the maximum allowed size, in Mb, for all items being exported with a grid report. A value of 0 sets no limit.
Review view
The Review View allows investigators to view and examine items in a larger view, displaying more detail about each item. From this view, items can be displayed as either plain text or PDF. It also features Redaction mode which can be enabled to redact or highlight areas within an item. All items that are responsive to the active search query can be displayed within the Review View, one item at a time, as full-size documents.
Depending on the selected item type, different tabs are displayed across the top of the view to change how the item can be displayed. Possible tabs include:
Redaction: Enable Redaction mode.
Near native viewer: View supported items in a native Microsoft Office view.
PDF view: View the selected item as a PDF.
Preview: View the selected item as plain text.
Chat view: View the selected Chat message or Conversation in a mobile-style messaging format.
Located below the display selection tabs, general metadata associated with the selected item is displayed. This section also includes the following actions.
| Action |
Icon |
Description |
| |
|
Click icon and follow the prompts in the browser’s print window to print a chat conversation including all imbedded images and attachments. |
| Download |
|
Click to download the native form of the selected item. |
| Rotate |
|
Click to rotate an image counterclockwise or clockwise. |
| Text size |
A+ A- |
Click to increase or decrease the size of the text. |
| Attachment |
|
Visible when an item includes an attachment. |
| Tags |
|
Visible when an item has tags applied. With tagging privileges, click to open the Tags tab of the Metadata Preview Pane. |
| Comments |
|
Visible when an item has comments. Click to open the Comment window for the selected item. |


Note: The Download and PDF view options are only visible to administrators or Users who belong to a group with the Download or Enable PDF View privileges within UMS.
Below the header is the preview window, which displays the item for further review.
Redaction
The Review View provides tools that enable investigators to redact sensitive content within selected items.
Note: Redaction mode is only available to administrators or Users who belong to a group with the Redaction - Apply privilege within UMS.
Click the Redaction tab from within the view to enable redaction mode for supported items.
To enable redaction mode, evidence binary must be stored within the case or in a location defined by the case's evidence file that is still accessible.
Warning: When migrating cases, if binary was previously stored, it must also be migrated to redact items within the case.
The selected item must also be one of the following item kinds:
Calendar
Chat Conversations
Chat Messages
Documents
Drawing
Images
Other Documents
Presentations
Spreadsheets
Text Files
Note: If a non-supported item is selected for redaction, an "Unprintable document - refer to native file" slip sheet will be displayed within the view.
Once enabled, navigate the pages of an item by using the page selectors from the action bar at the top of the redaction view. User the page zoom slider bar to adjust the rotation of the page or change the level of zoom used to view an item. Once the rotation or zoom level for a page is changed, the settings persist across all other pages of an item. Selecting a different item from the result set resets these settings back to their default values.
After redaction mode is enabled, a Markup Set must be applied before redactions and highlights can be drawn. If a Markup Set already exists, select it from the Select a Markup Set list.
Manage markup sets
Markup Sets provide a method for managing the redactions and highlights that exist within a case. They can also be used to specify details about why something was redacted. If a reason is specified within the Markup Set, such as CONFIDENTIAL, it is printed within the obscured redacted area on the item.
Note: Only administrators or Users who belong to a group with the Redaction - Markup Sets privilege within UMS can create and manage Markup Sets.
When a redaction is drawn, it is associated with the currently applied Markup Set. Items can contain redactions from multiple Markup Sets, but only one set is viewable within Redaction mode at a time. If a Markup Set is removed, all associated redactions are also removed.
To create a new Markup Set or edit an existing Markup Set:
On the Redaction tab, click the Manage Markup Sets  icon within the Review View to open the Markup set management window.
To edit an existing Markup Set, hover over it within the list and then click the Edit  icon.
icon.
To create a new Markup set, click +Add new Markup Set.
In the Markup set management dialog, specify:
A name for the new Markup Set.
The Markup Set name must be less than 256 characters and following characters cannot be used:
. , / : * ? " < > ; + - ( ) { } % $ # &
A reason for the redaction that is printed within redacted areas.
A description for the new Markup Set.
Click Create Markup Set to save the markup set and close the Markup set management window.
After a Markup Set is created, it is displayed within the Select a Markup Set list.
To remove a Markup Set:
Click the Manage Markup Sets  icon within the Redaction tab of the Review View.
Select the Markup Set to be removed.
Select the Remove Markup Set check box.
Click Delete Selected Markup Set.
Warning: Deleting a Markup Set is a permanent action that also removes any redactions that were applied using the Markup Set.
Markup Sets remain applied until a different Markup Set is selected from the list.
Apply redactions
Redactions can be drawn over any part of an item to obscure the underlying information. When in Redaction mode, these areas are displayed as translucent gray boxes, but becomes opaque once the item is exported.
After enabling Redaction Mode and applying a Markup Set, the redaction pen is selected by default.
To redact sections of an item:
Left-click and drag the cursor over the section of the page to be redacted.
Release the cursor to complete the redaction.
Repeat until all redactions are made within the page.
Redaction mode also provides a highlight pen. When selected, you can draw translucent yellow boxes over any part of an item. Highlighted areas remain translucent when the item is exported.
To highlight sections of an item:
Select the highlight pen button.
Left-click and drag the cursor over the section of the page to be highlighted.
Release the cursor to complete the highlight.
Repeat until all highlights are made within the page.
When in Redaction mode, the pages of an item can be rotated clockwise or counterclockwise. When rotated, any redactions or highlights that have been applied also rotates with the page.
To remove a redaction or highlight from a page, select a redaction or highlight on the page and press the Delete key on your keyboard.
Gallery view
The Gallery View provides a platform to quickly view thumbnails of images and other multimedia that are included in the current search query. Regardless of content, the Gallery View displays all items that are included in the result set. For items that do not contain image or multimedia data, an icon that represents the items kind is displayed instead.
Selecting an item within the Gallery View opens the Default Preview pane, allowing you to inspect the contents of the item. Each item thumbnail within the Gallery also provides access to the following actions:
| Action |
Description |
|
|
Click the check box to select the item. |
|
|
Click the Download native icon to download the native form of the item. |
|
|
Visible when an item has tags applied. Click to open the Tags tab of the Metadata Preview Pane. |
|
|
Visible when an item has comments. Click to open the Comment pane for the selected item. |


Click Select All from the bottom navigation bar to select all items that are included in the current result set. The total number of selected items is displayed at the bottom of the view. To unselect all currently selected items, click Deselect All.
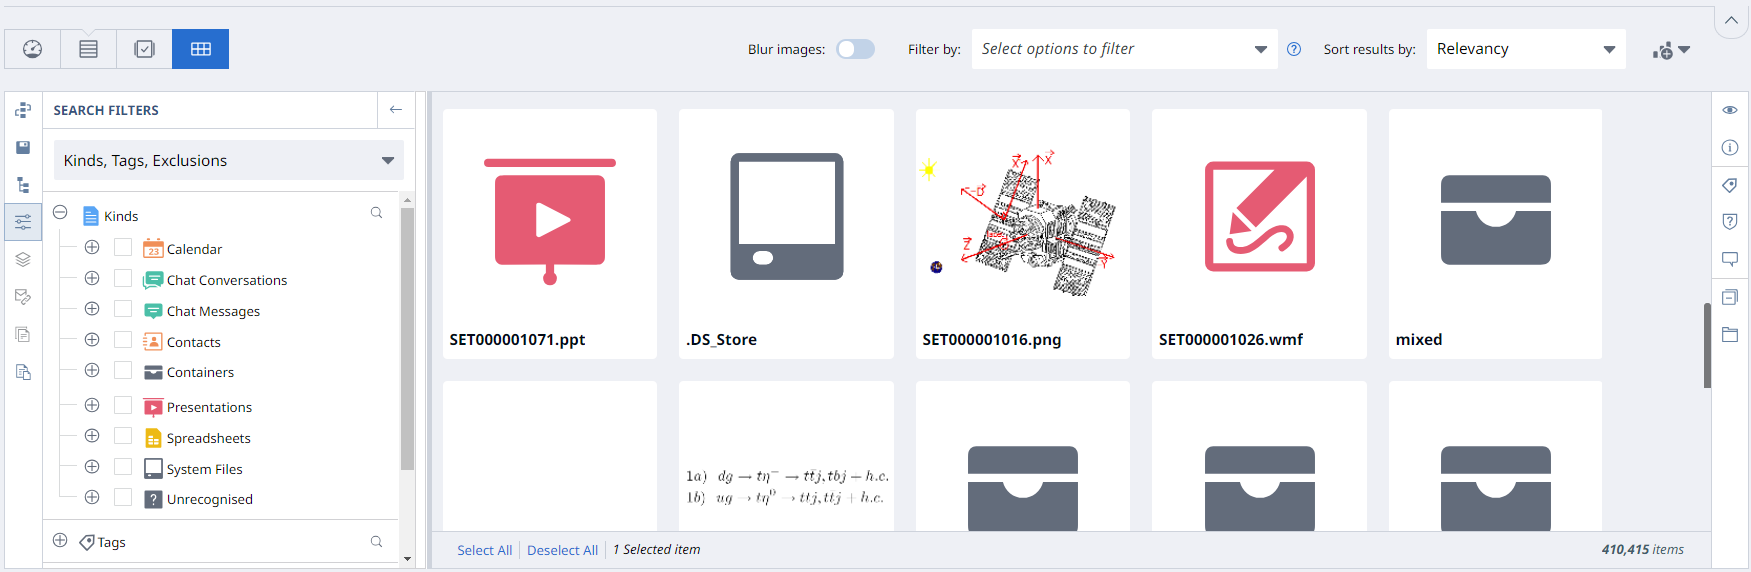
Select Blur images to slightly blur all items that contain a thumbnail.
Expand the Filter by menu to select a filter. When a filter is chosen, a pill is added to the query. Available filtering methods include:
Skin tone: Select the percentage of flesh tones from Low, Medium, High, and Severe. Note that this filter is only available if the Perform image colour and skin-tone analysis option was selected in Data Processing Settings during ingestion.
More filters (Images with faces): Choose to only show images with faces. Note that this filter is only available if the Detect Faces option was selected in Data Processing Settings during ingestion.
Available sorting methods by using Sort results by include:
Item Date (Ascending/Descending): Sort results by item date.
Position: Sort results based on an item’s position within the evidence set. Position sorting preserves the original parent/child ordering of items that is captured during ingestion.
Relevancy (Default): Sort results based on how relevant an item is to the current effective query.
Identify related items
To search for related items within the Gallery View, select one or more items within the view and then right-click within the view to open the context menu and choose from one of the following search methods.
Pivot: Perform a pivot search based on the time or location data within selected items.
Show All Options: Cull the current result set to only show one of the following item types:
Top-level Items
Descendants
Families
Show in Directory Browser: View the parent container of the selected item in the Directory Browser.
Investigate Connections: View the currently selected items within the Investigate Connections view.
Find similar images
On the Grid or Gallery view, from the context menu for an image, select Find similar images to show any images that are like the original image. The results display in a new browser tab if the Enable New Tab Pivot Searches property is enabled.
Note: The Find similar images option only appears in the context menu of an image under certain conditions:
a. This feature is available for licenses that have the PhotoDNA feature flag. The Nuix Web Reviewer and Nuix Email Archive Examiner licenses do not have the ability to have this flag.
b. This feature is available if the item was processed with the PhotoDNA setting turned on under Data Processing Settings > Digest Settings during ingestion.